...
| Excerpt |
|---|
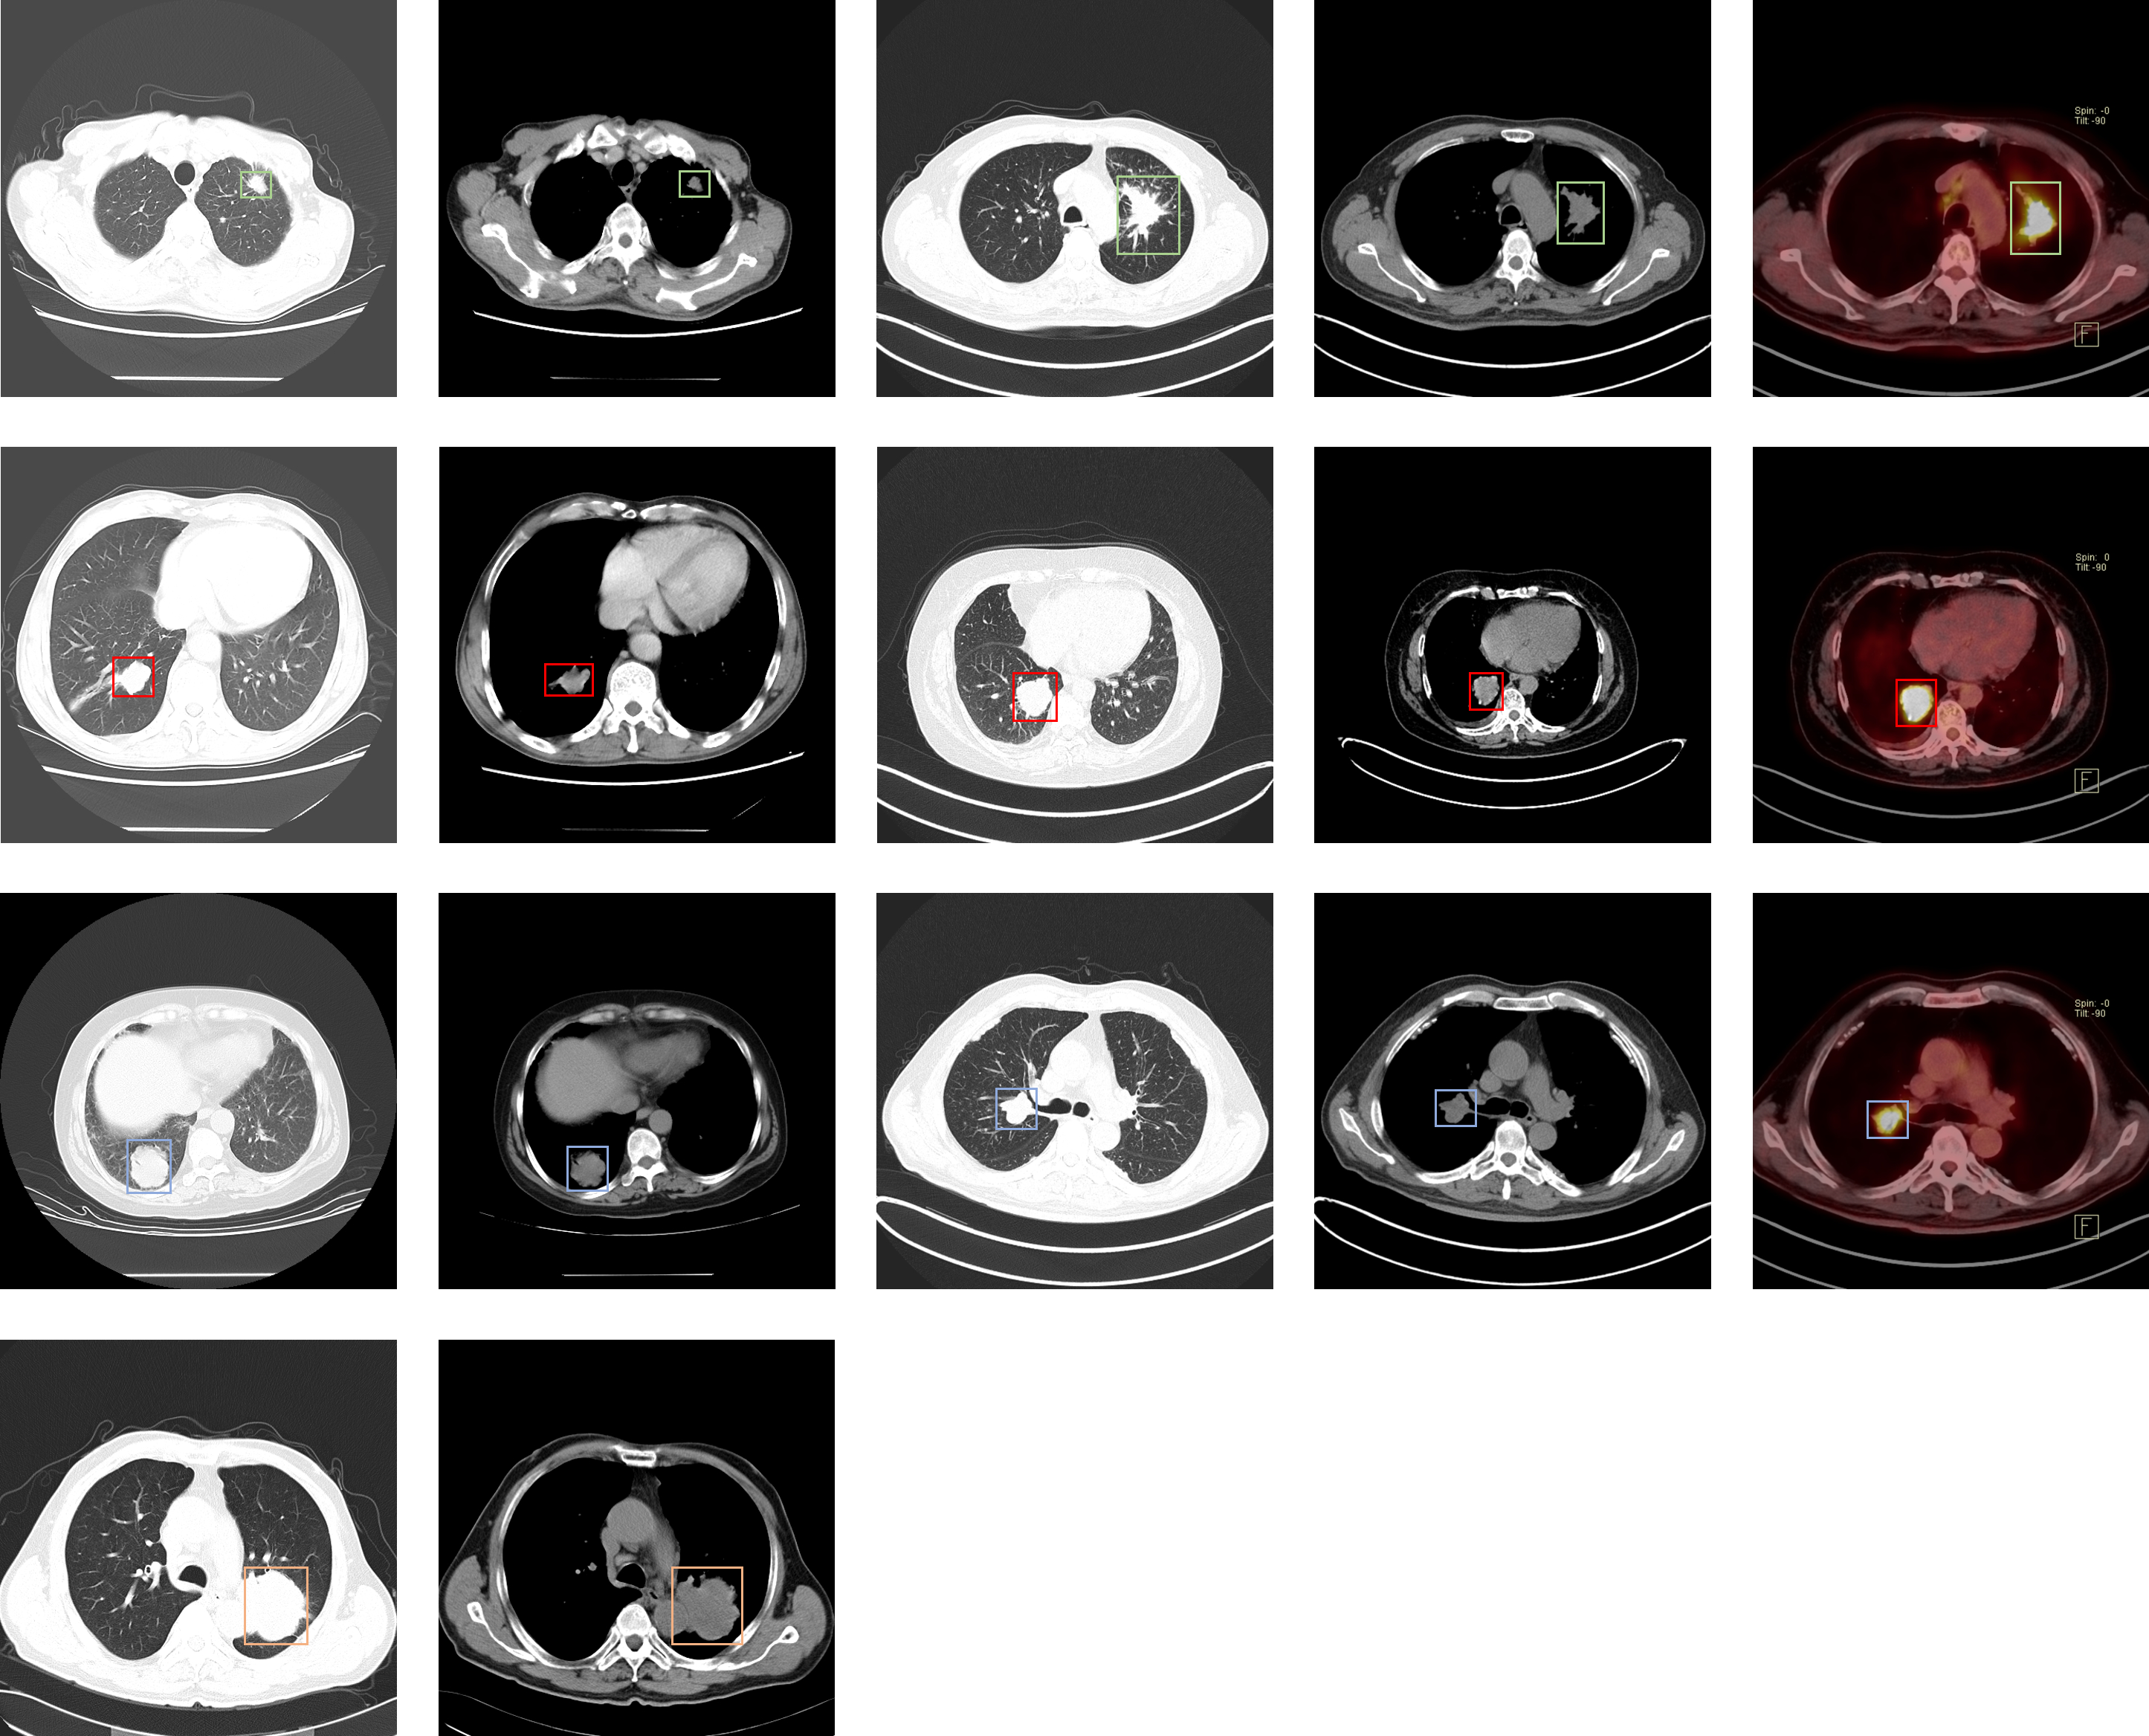 This dataset consists of CT and PET-CT DICOM images of lung cancer subjects with XML Annotation files that indicate tumor location with bounding boxes. The images were retrospectively acquired from patients with suspicion of lung cancer, and who underwent standard-of-care lung biopsy and PET/CT. Subjects were grouped according to a tissue histopathological diagnosis. Patients with Names/IDs containing the letter 'A' were diagnosed with Adenocarcinoma, 'B' with Small Cell Carcinoma, 'CE' with Large Cell Carcinoma, and 'G' with Squamous Cell Carcinoma. The images were analyzed on the mediastinum (window width, 350 HU; level, 40 HU) and lung (window width, 1,400 HU; level, –700 HU) settings. The reconstructions were made in 2mm-slice-thick and lung settings. The CT slice interval varies from 0.625 mm to 5 mm. Scanning mode includes plain, contrast and 3D reconstruction. Before the examination, the patient underwent fasting for at least 6 hours, and the blood glucose of each patient was less than 11 mmol/L. Whole-body emission scans were acquired 60 minutes after the intravenous injection of 18F-FDG (4.44MBq/kg, 0.12mCi/kg), with patients in the supine position in the PET scanner. FDG doses and uptake times were 168.72-468.79MBq (295.8±64.8MBq) and 27-171min (70.4±24.9 minutes), respectively. 18F-FDG with a radiochemical purity of 95% was provided. Patients were allowed to breathe normally during PET and CT acquisitions. Attenuation correction of PET images was performed using CT data with the hybrid segmentation method. Attenuation corrections were performed using a CT protocol (180mAs,120kV,1.0pitch). Each study comprised one CT volume, one PET volume and fused PET and CT images: the CT resolution was 512 × 512 pixels at 1mm × 1mm, the PET resolution was 200 × 200 pixels at 4.07mm × 4.07mm, with a slice thickness and an interslice distance of 1mm. Both volumes were reconstructed with the same number of slices. Three-dimensional (3D) emission and transmission scanning were acquired from the base of the skull to mid femur. The PET images were reconstructed via the TrueX TOF method with a slice thickness of 1mm. The location of each tumor was annotated by five academic thoracic radiologists with expertise in lung cancer to make this dataset a useful tool and resource for developing algorithms for medical diagnosis. Two of the radiologists had more than 15 years of experience and the others had more than 5 years of experience. After one of the radiologists labeled each subject the other four radiologists performed a verification, resulting in all five radiologists reviewing each annotation file in the dataset. Annotations were captured using Labellmg. The image annotations are saved as XML files in PASCAL VOC format, which can be parsed using the PASCAL Development Toolkit: https://pypi.org/project/pascal-voc-tools/. Python code to visualize the annotation boxes on top of the DICOM images can be downloaded here. Two deep learning researchers used the images and the corresponding annotation files to train several well-known detection models which resulted in a maximum a posteriori probability (MAP) of around 0.87 on the validation set. |
...