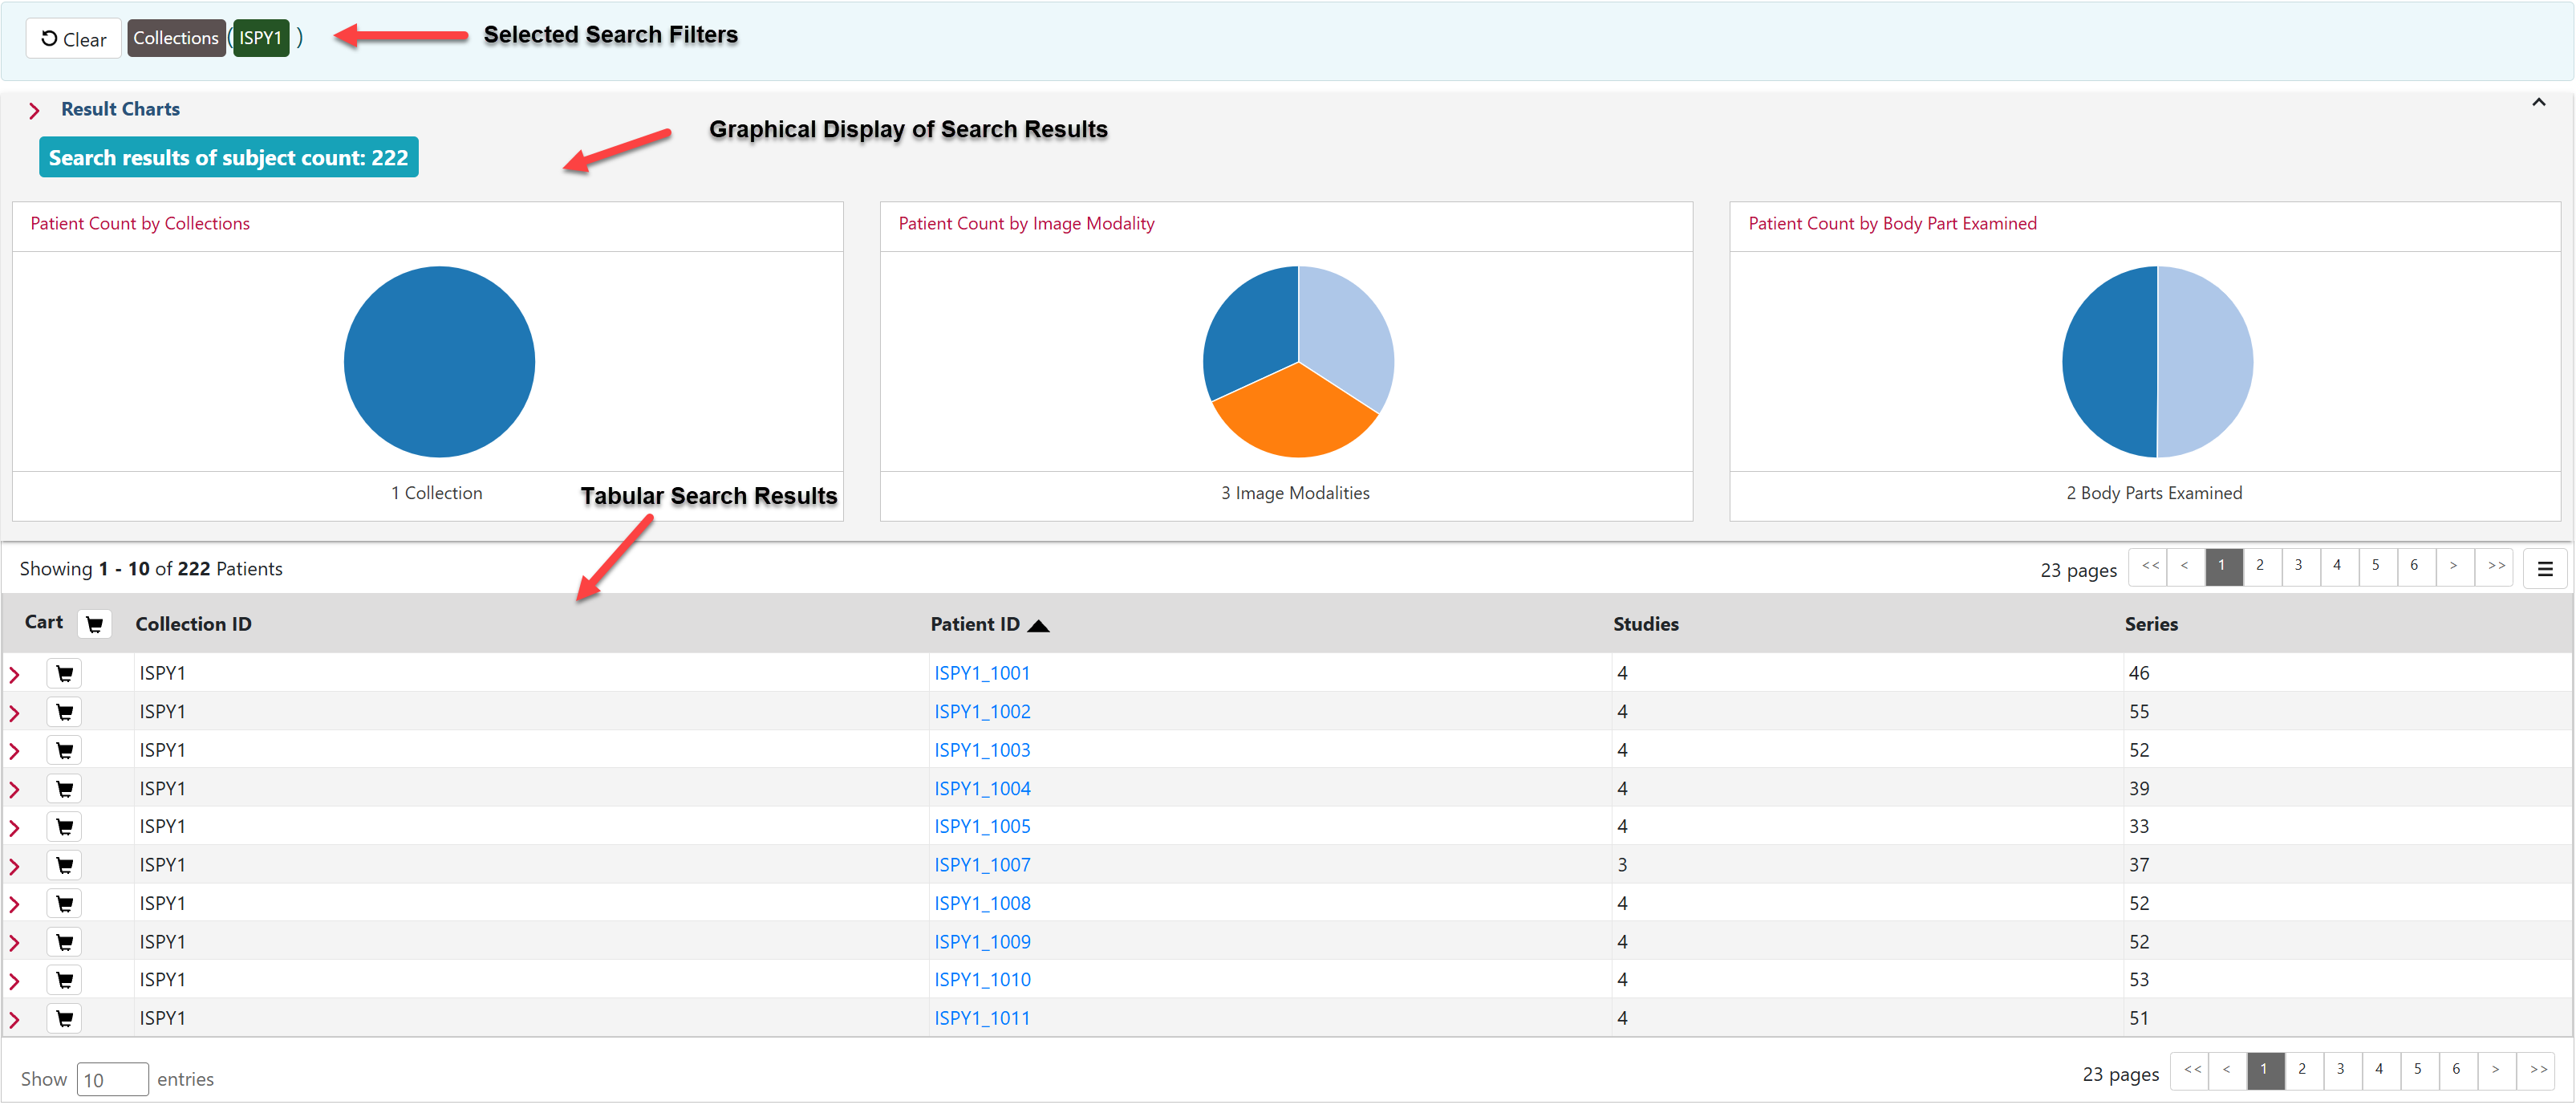
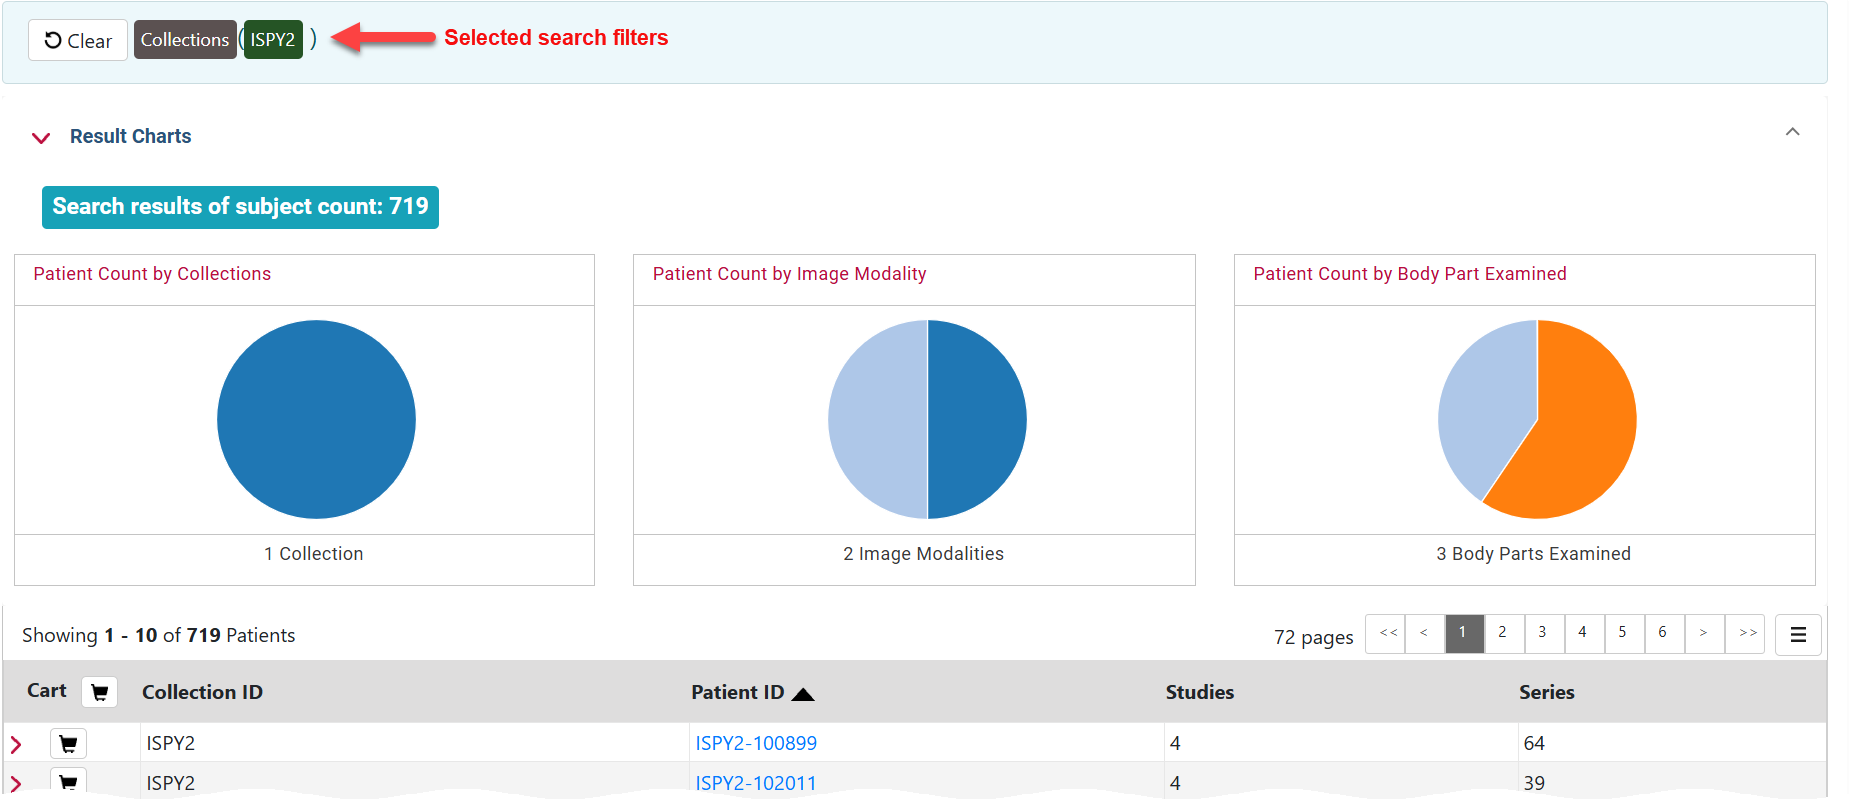
The search results from your query are presented in a table with the search filters summarized at the top. Each record in the table corresponds to one subject (patient) and displays the collection(s), study(ies), and image series associated with that subject.
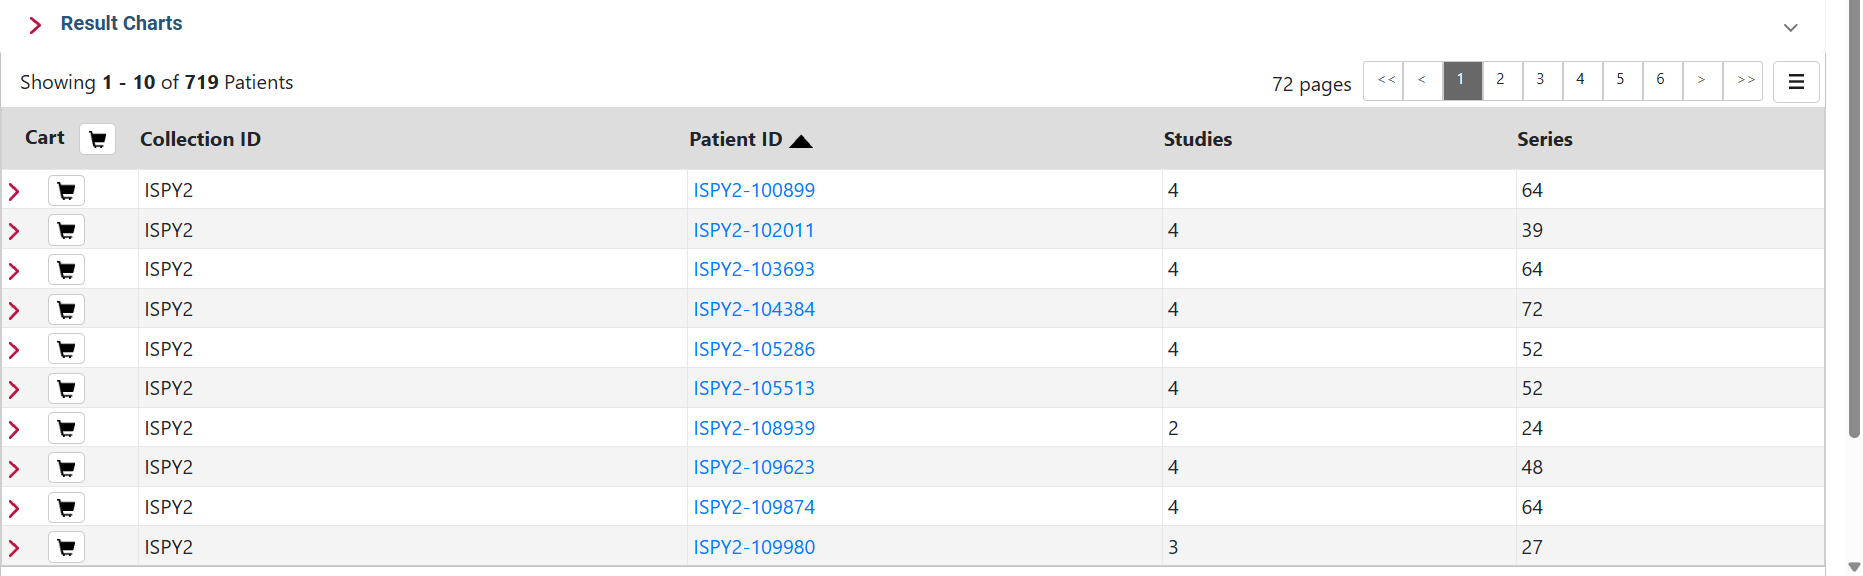
Click Result Charts to open a view of your search results in chart form and the search filters you selected at the top. These charts show counts of collections, image modalities, and body part examined in the database. Each pie "slice" is a filter you can use to narrow the data in the portal. Hover over a pie chart slice to view the name of each filter. The size of each pie slice is relative to the size of that filter's representation in the database.
Select which columns you want to have appear in the table by clicking at the top of the table. The Pick columns panel appears.
...