...
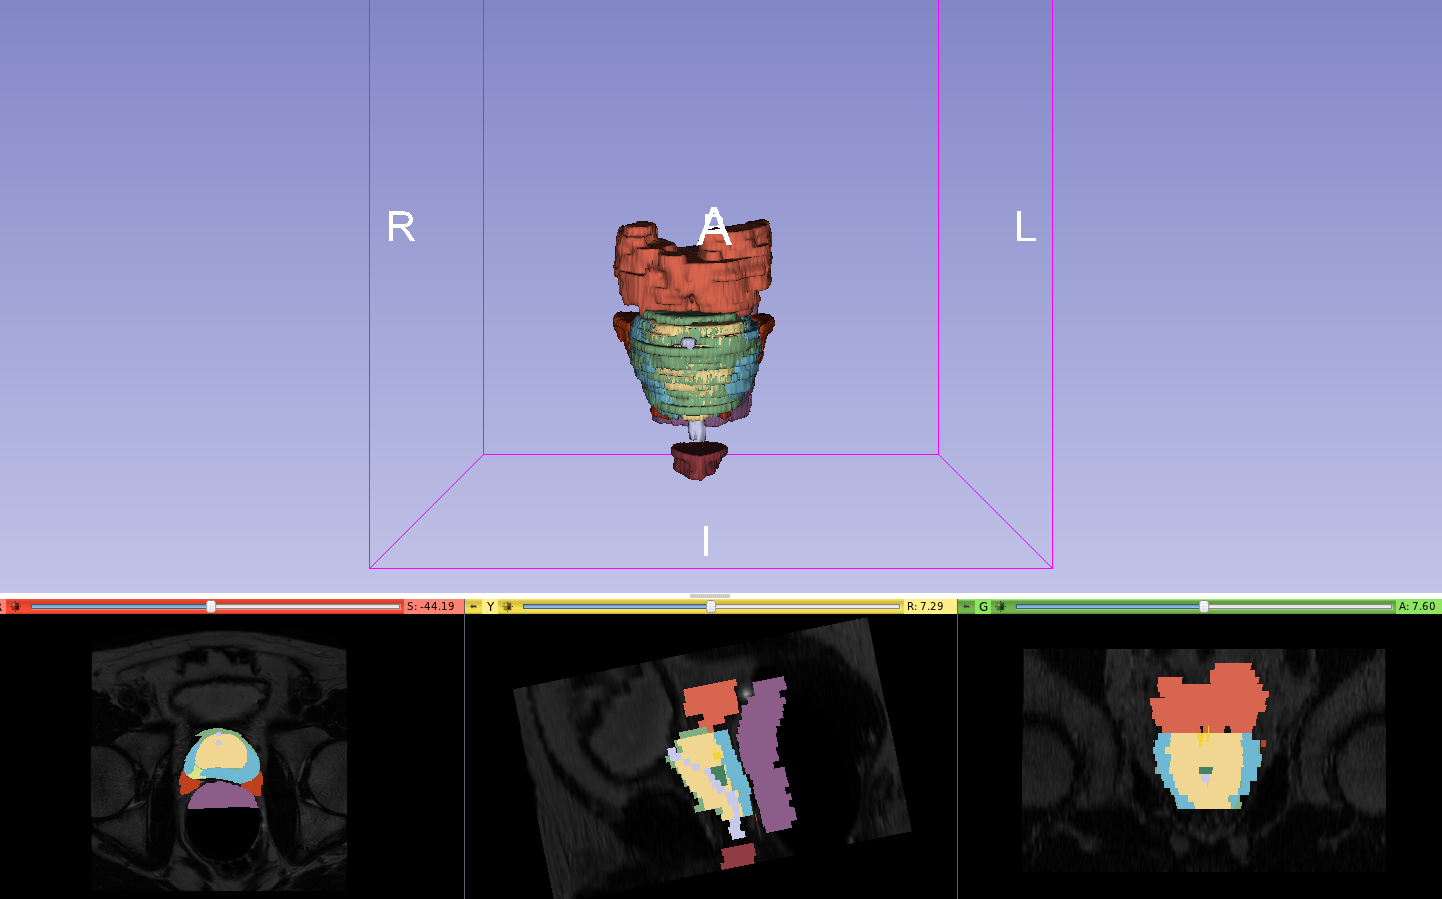
Click "Apply" at the bottom of the module and should now see a 3D rendering of the NRRD label map in the main viewing window.
Visualizing the combined DICOM and NRRD data
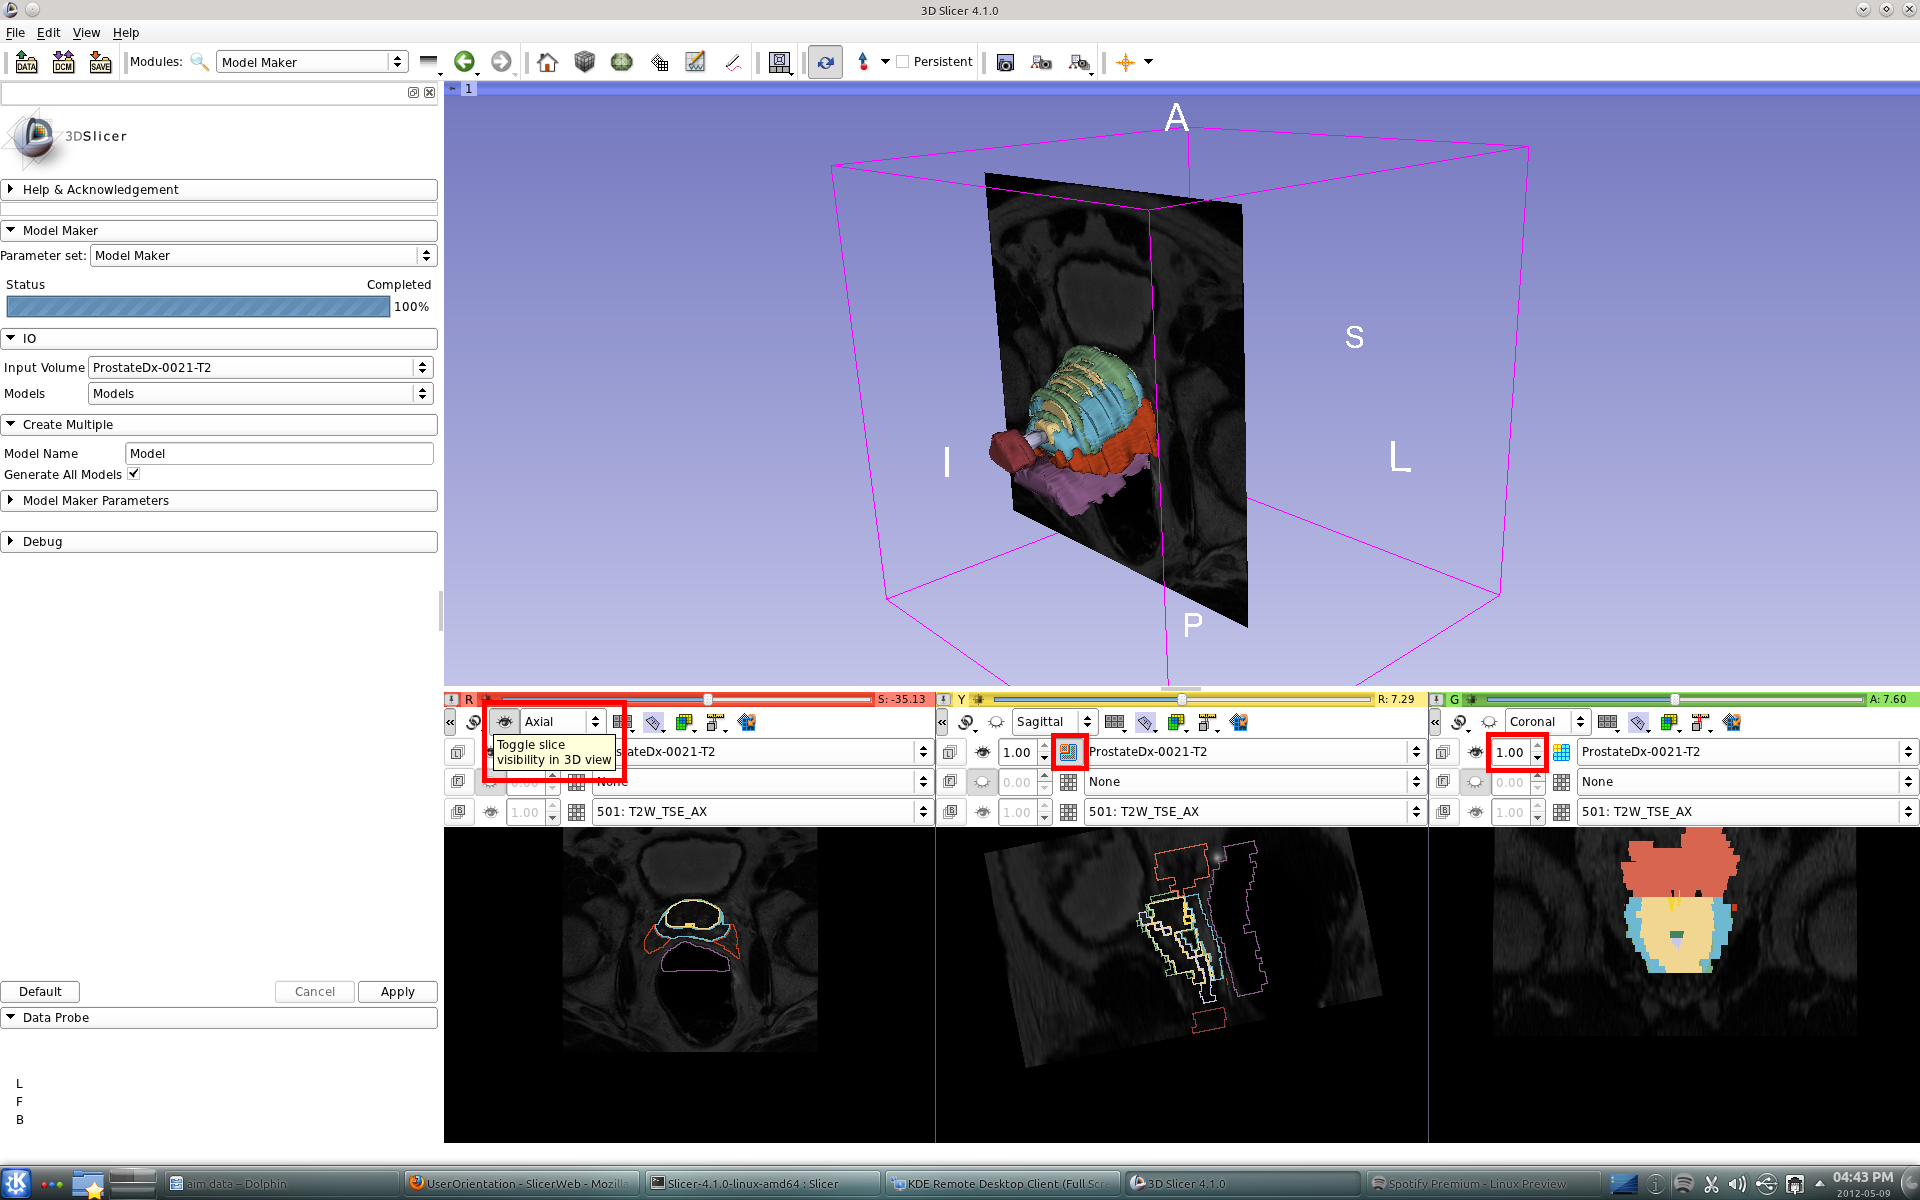
If you prefer you can now tweak some settings to further visualize the data. The following settings are visible emphasized in the screenshot below.
- You can toggle between showing the label map with regions outlined or filled by clicking the small pushpin on each of the 2D views and selecting or deselecting the button next to the label map name.
- You can modify the transparency of the label map by using the up/down arrows next to the label map name. The starting value is "1.00" which is fully opaque.
- You can also toggle whether the DICOM slices are visible in the 3D view by clicking the visibility button next to the slice orientation.
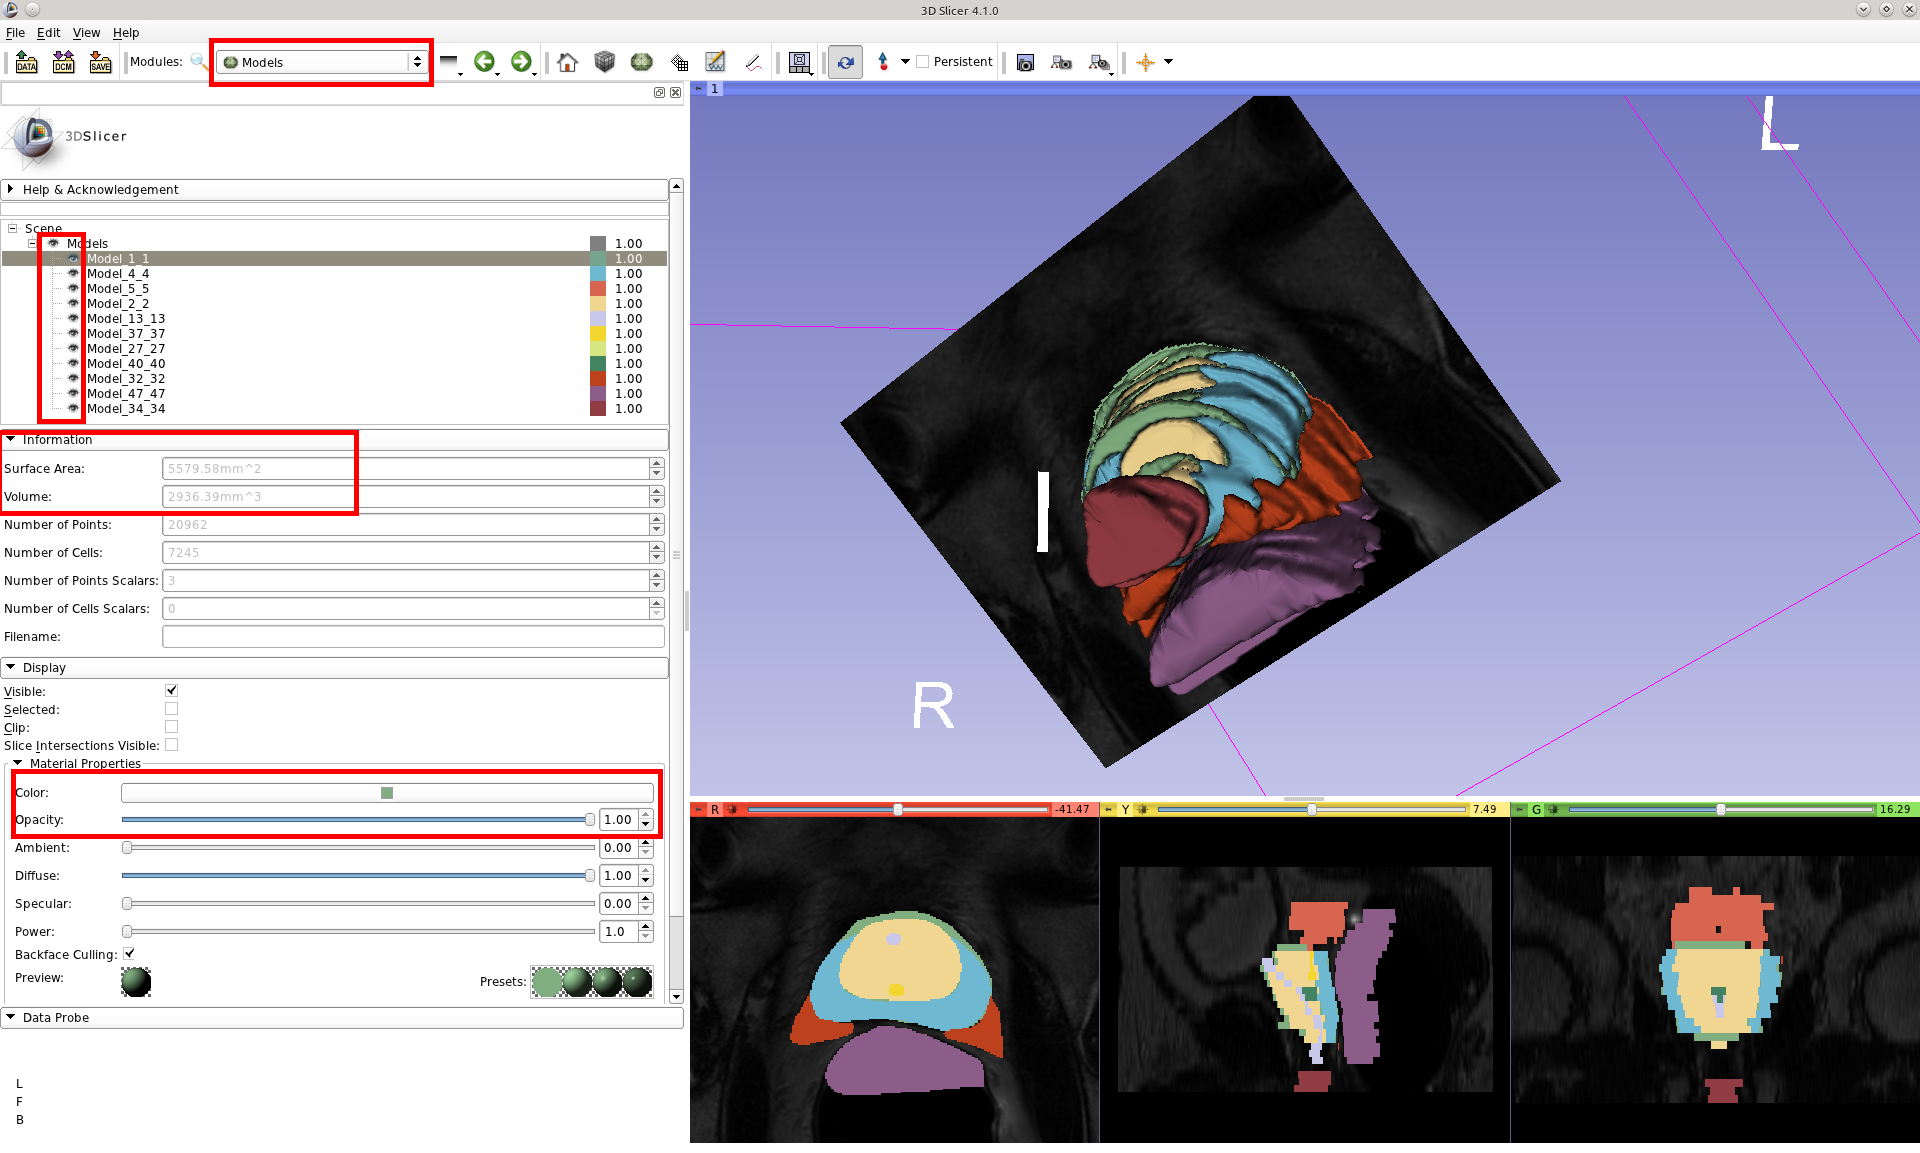
You can also customize the 3D Model view by switching from the Model Maker module to the Models module. Clicking on each of the model components in the list presents options for changing the visibility, colors, opacity, etc. You can also view information about each segmentation component such as surface area and volume.