Detailed Description | |
|---|
Modalities | PT, CT, MR, CR, DX, SC
| Number of Patients | 193 | Number of Studies | 828 | Number of Series | 2,981 | Number of Images | 436,165 | | Image Size (GB) | 127.8 |
Study Accrual: Accrual began in June 2005 and ended in May 2009. Thirty-seven institutions accrued 250 patients to the study. Sixteen patients were ineligible, and eight patients did not have evaluable pretreatment PET, leaving 226 patients. Of these 226 patients, 173 had evaluable post- treatment PET, representing the analysis cohort for the primary end point. Date Offsets: All dates, like the visit date, are protected by presenting just the year; however, dates are also listed as offset days from the base date. The offset dates are used as a means of protecting patient information provided by the local sites in the original data, while allowing users to determine intervals between events. The standard DICOM date tags (i.e. birth dates, imaging study dates, etc.) have been de-identified so that all patients have a baseline study date of January 1, 1960. This falsified date represents the day patients were entered into trial database. The number of days between a subject’s longitudinal imaging studies are accurately preserved. A patient with a study performed on January 4, 1960 means the images were collected 3 days after the base date. For convenience, this calculation has been performed for all scans with the results inserted in DICOM tag (0012,0050) Clinical Trial Time Point ID. This means an imaging study that took place on January 4, 1960 would contain a value of "3" in tag (0012,0050). Imaging Protocol: Conventional modern equipment/techniques for FDG-PET (with or without PET/CT) were used in this study. Patients had to fast for 4 hours and have a blood glucose level less than 200 mg/dL before FDG injection. The FDG dose was not mandated; the recommended dose was 0.14 to 0.21 mCi/kg (approximately 10 to 20 mCi). Emission scanning began 50 to 70 minutes after FDG injection and included the body from upper/mid neck to proximal femurs. Acquisition times for emission and transmission scans were in accordance with the manufacturer’s recommendations. Image Analysis: PET scans were interpreted qualitatively and quantitatively by nuclear medicine physicians/radiologists at each institution, using standardized reporting forms to record the FDG uptake in the primary tumor, regional lymph nodes, and common sites of distant metastasis (ie, bones, adrenals, liver, contralateral lung). These local reviewers were provided with educational materials on image interpretation, specifically describing how to measure peak SUV (SUVpeak). However, formal demonstration of expertise was not mandated. SUVs for regions of interest (ROIs) were determined using two different metrics, maximum SUV (SUVmax) and SUVpeak. SUVmax represented the highest single-voxel SUV within the ROI. SUVpeak represented the mean SUV within a small circular ROI (0.75 to 1.5 cm in diameter) that encompasses the SUVmax voxel. (Thus, SUVpeak will always be lower than SUVmax.). In addition to the institutional interpretations, pre- and post-treatment PET scans were centrally reviewed at ACRIN by an expert nuclear medicine physician with extensive experience in FDG-PET. A single dedicated workstation was used for this purpose, and SUVpeak was measured with an automated program in a circular ROI 1.5 cm in diameter. The central reader was blinded to clinical data and the institutional SUV measurements. Outcomes: Patients were observed for a minimum of 2 years (or until death) after completion of treatment in accordance with standard clinical practice. Non-protocol PET imaging was allowed but not mandated.
Schema 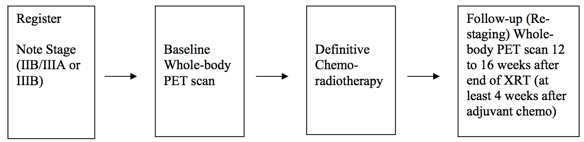
Much more information about this data set (ACRIN 6668 / RTOG 0235) can be found https://www.acrin.org/6668_protocol.aspx | 