You can search and download public data without logging in to the TCIA Data Portal. To access restricted data, however, you must log in first to see that data in your search results.
TCIA provides two ways to search for image studies:
When you first open TCIA Data Portal, the Summary tab displays filters for a simple search and pie charts showing counts of collections, image modalities, and anatomical sites in the database. Each pie "slice" is a filter you can use to narrow the data in the portal. Hover over a pie chart slice to view the name of each filter. The size of each pie slice is relative to the size of that filter's representation in the database.
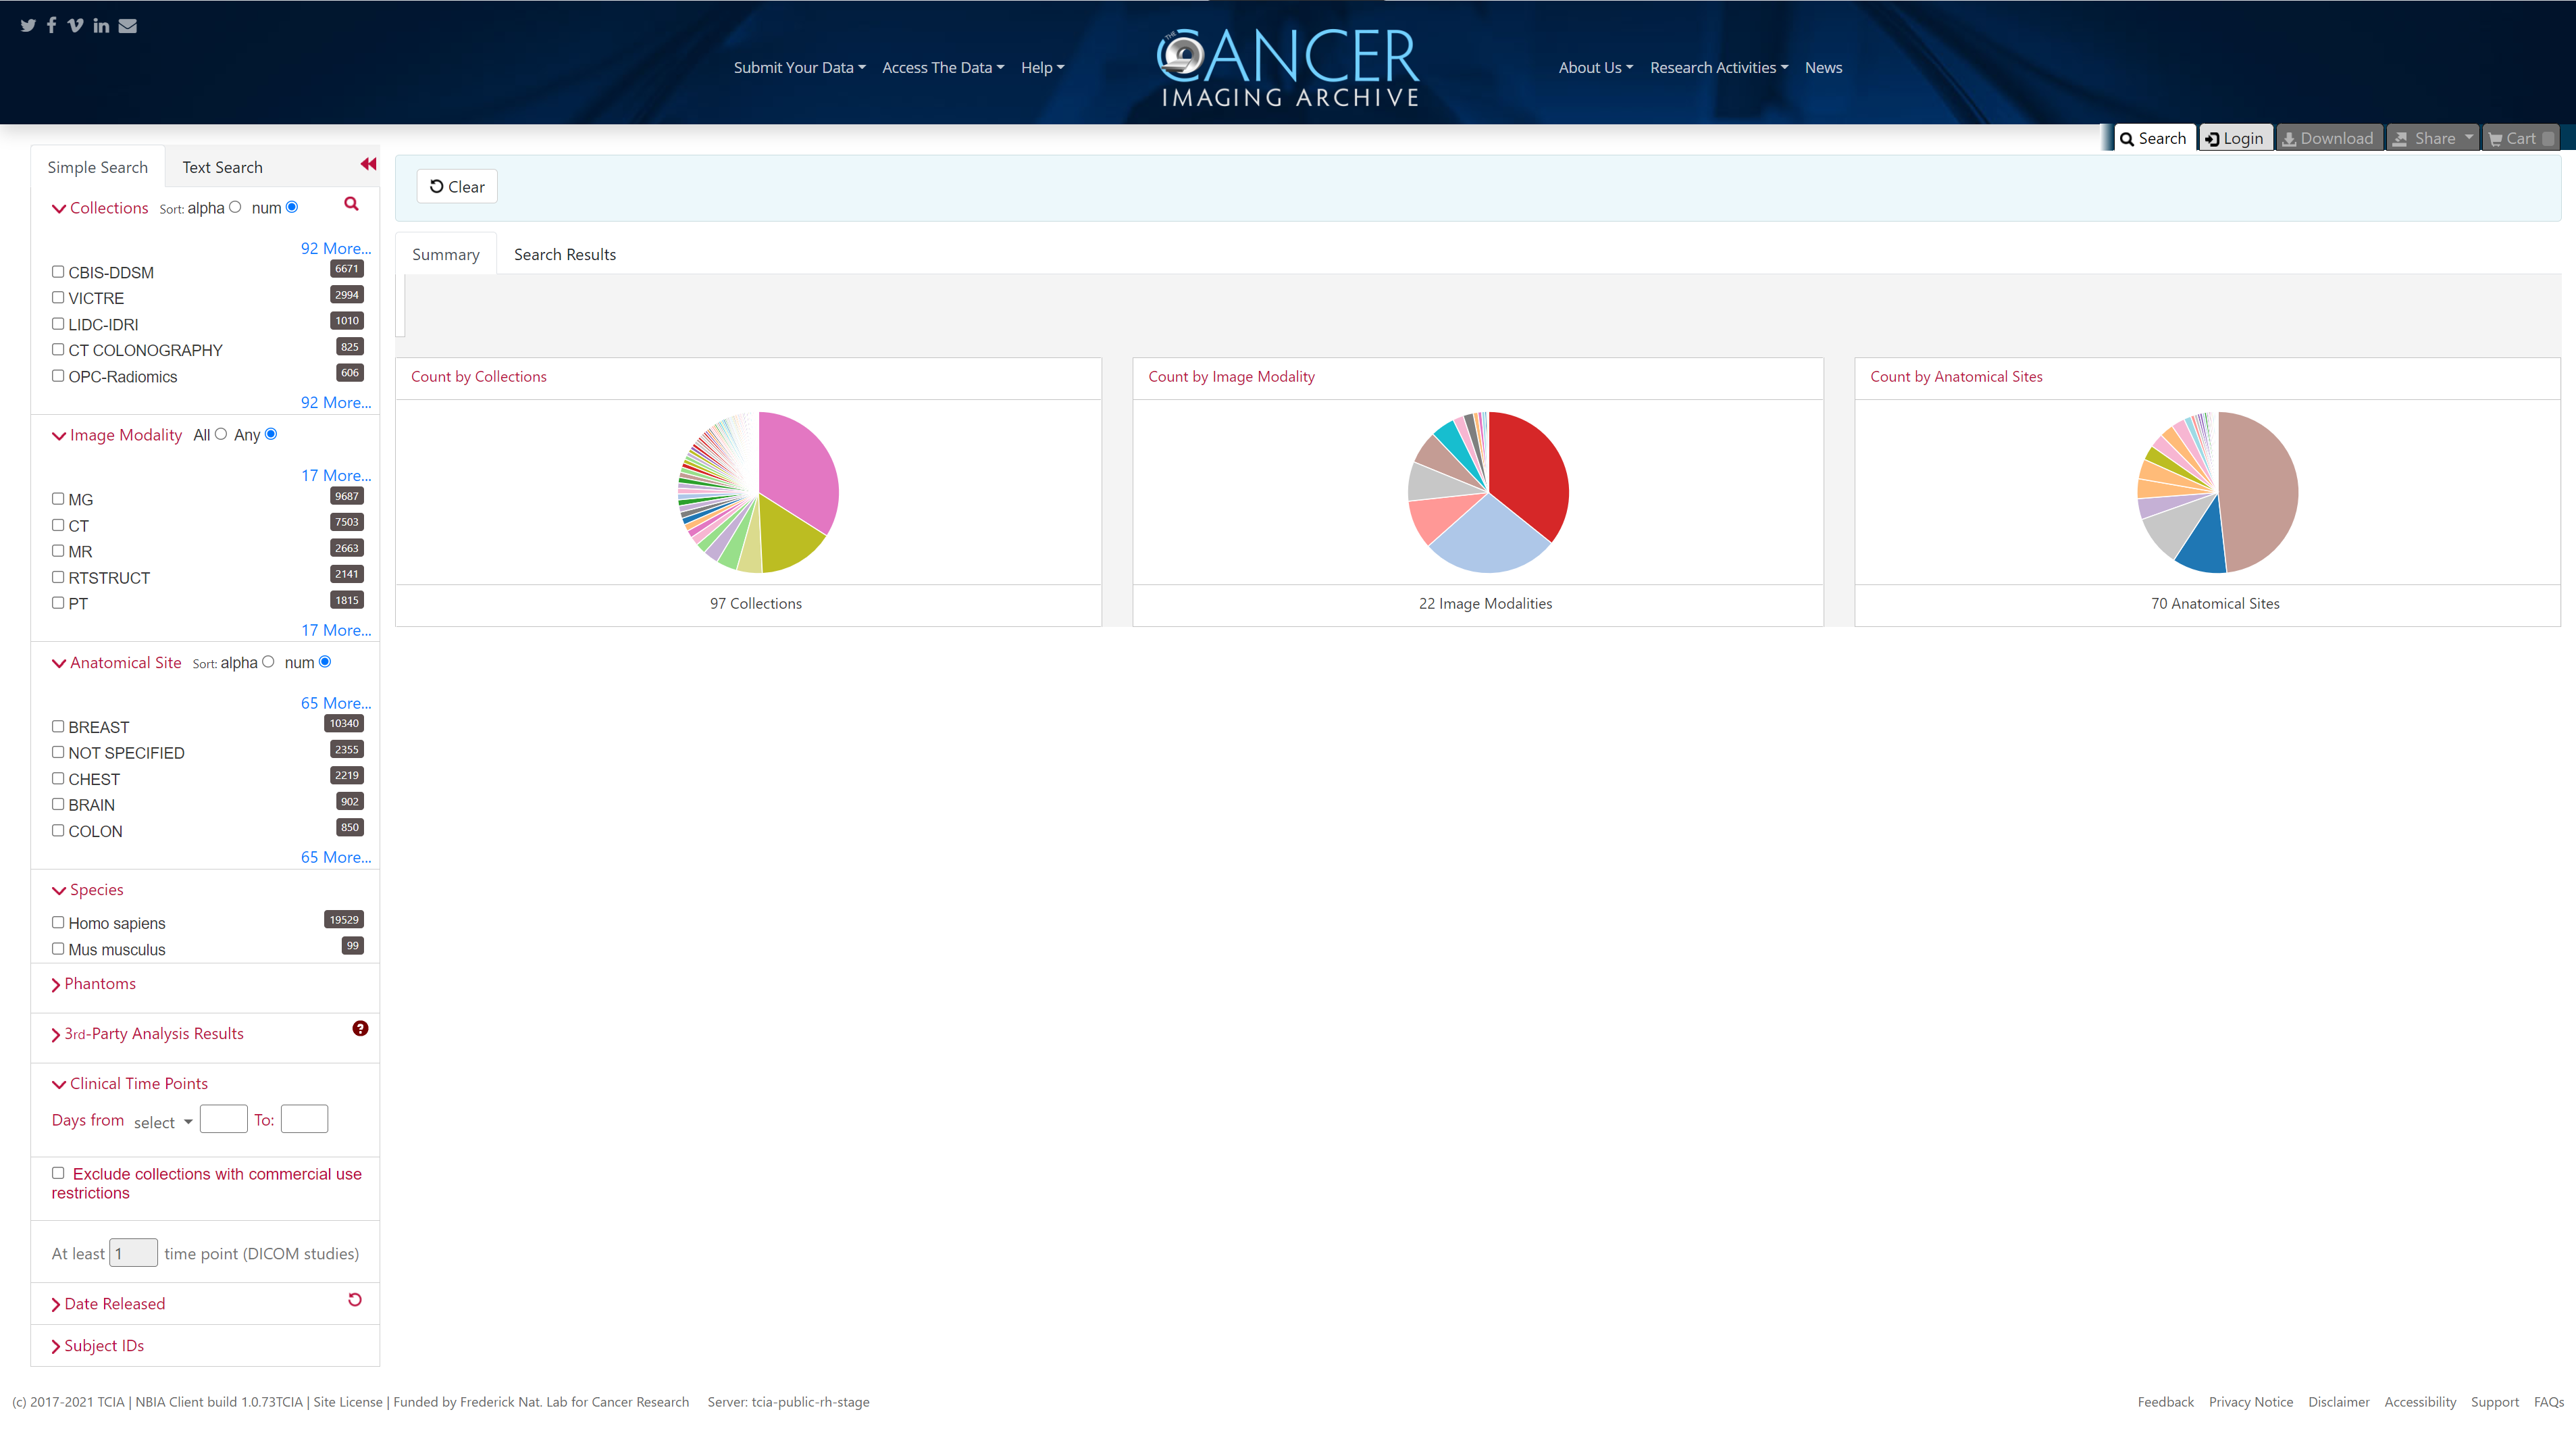
Click one or more boxes next to each search filter to select it. As you select search filters, they move to the top of the list. They also appear in Boolean query format above the pie charts. This query specifies the filters you have applied to your search. Click Clear if you want to remove all of your filters at once and start over. You can save your query as a URL for later use or to put in an email to a colleague. For more information about sharing, go to Sharing Data in Your Cart.
You can narrow your search by the following filters:
- Collections
- Image Modality
- Anatomical Site
- Species
- Phantoms
- 3rd-Party Analysis Results
- Clinical Time Points
- Exclude collections with commercial use restrictions
- Date Released
- Subject IDs
You can also specify the minimum number of image studies you want to match each search filter. For Collections, if you know the name of the collection, click ![]() to enter it instead of finding and clicking the collection's box.
to enter it instead of finding and clicking the collection's box.
3rd-party analysis results are derived data (e.g. segmentations) that were contributed by researchers who were not part of the group that originally submitted a collection to TCIA.
The Simple Search page shows a summary of image studies that match your search criteria. Your selections appear in the following ways:
- Boxes you selected are checked.
- Pie charts update to show the exact search results.
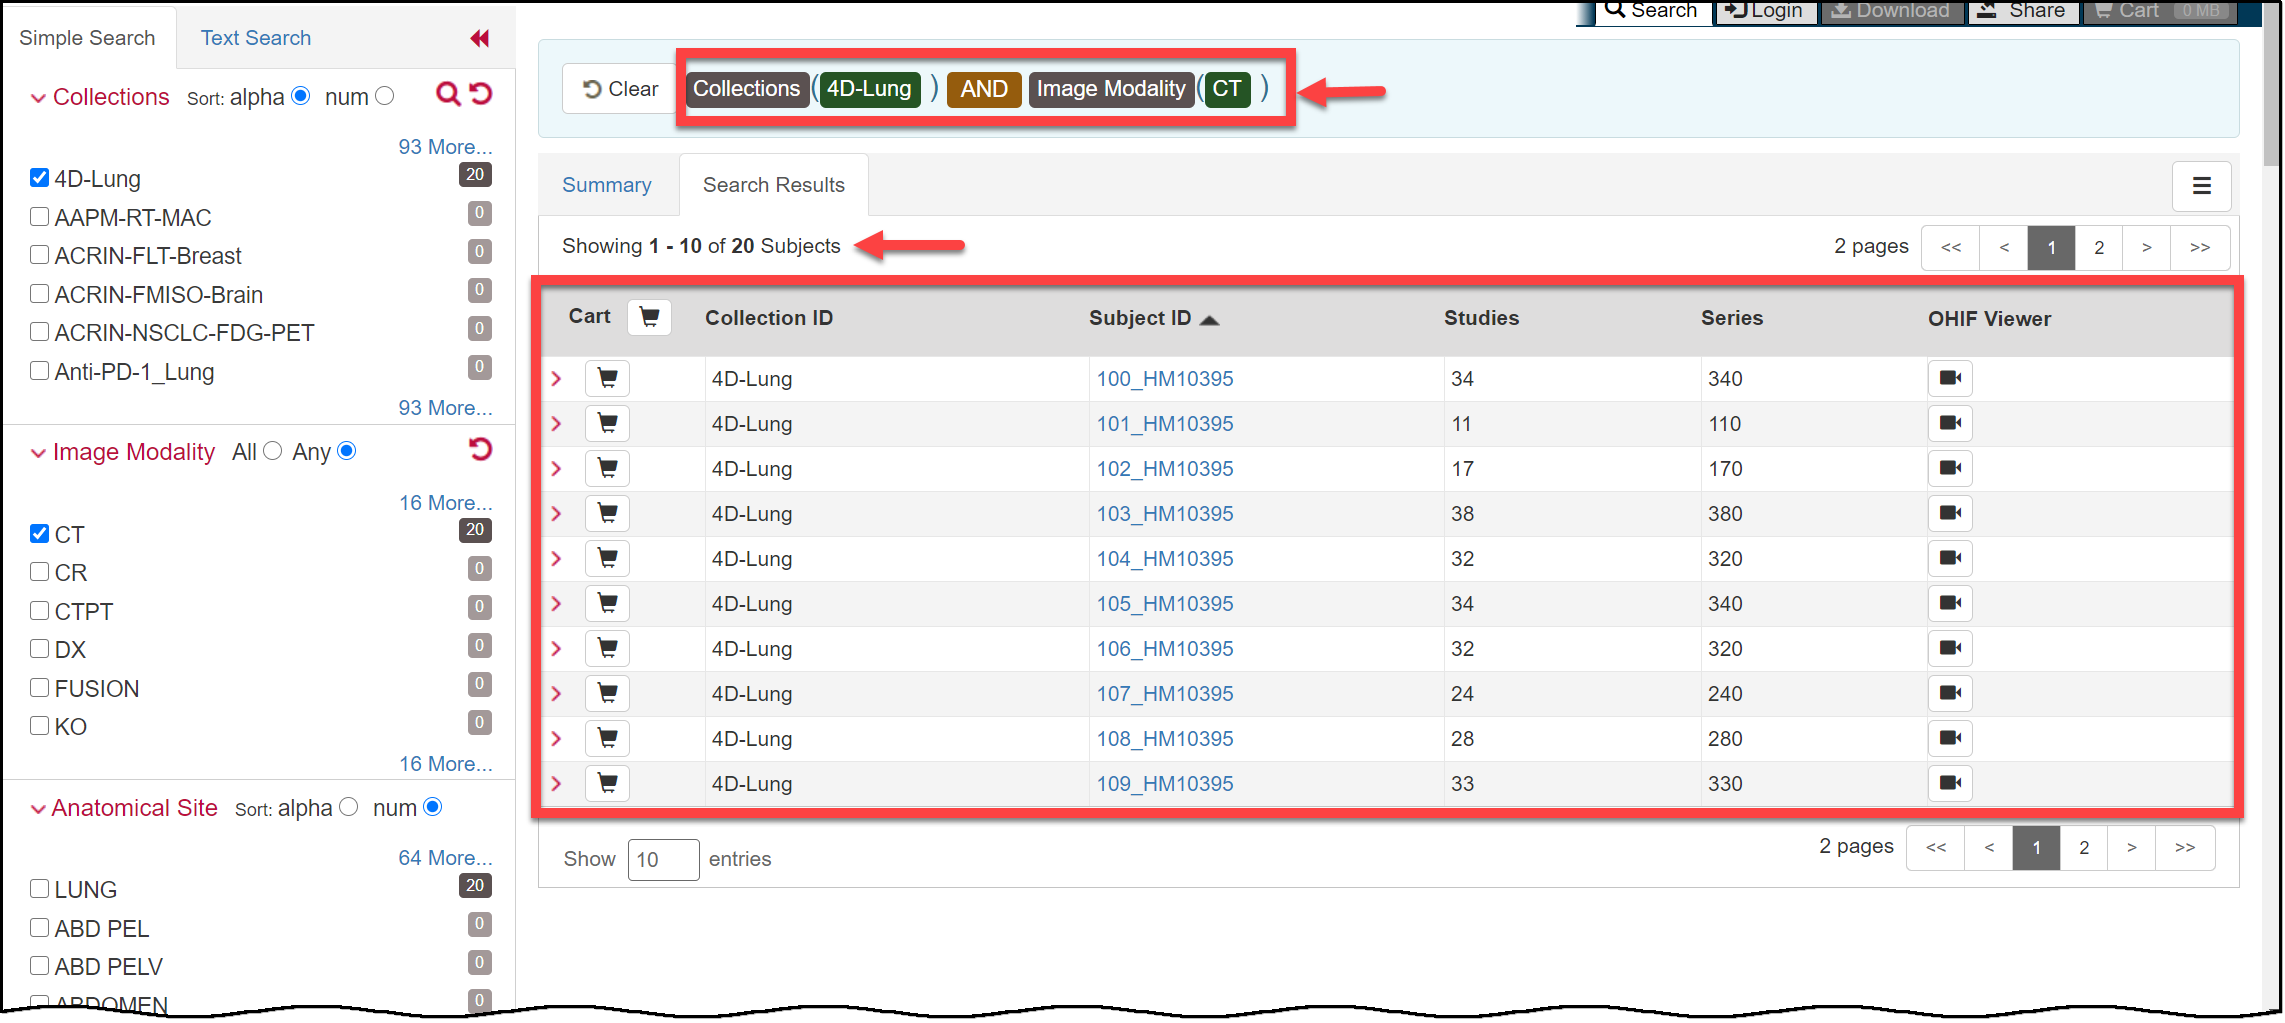
- Breadcrumb-style labels at the top of the page show the applied search filters (not all may display due to space constraints).
- Count of search results appears.
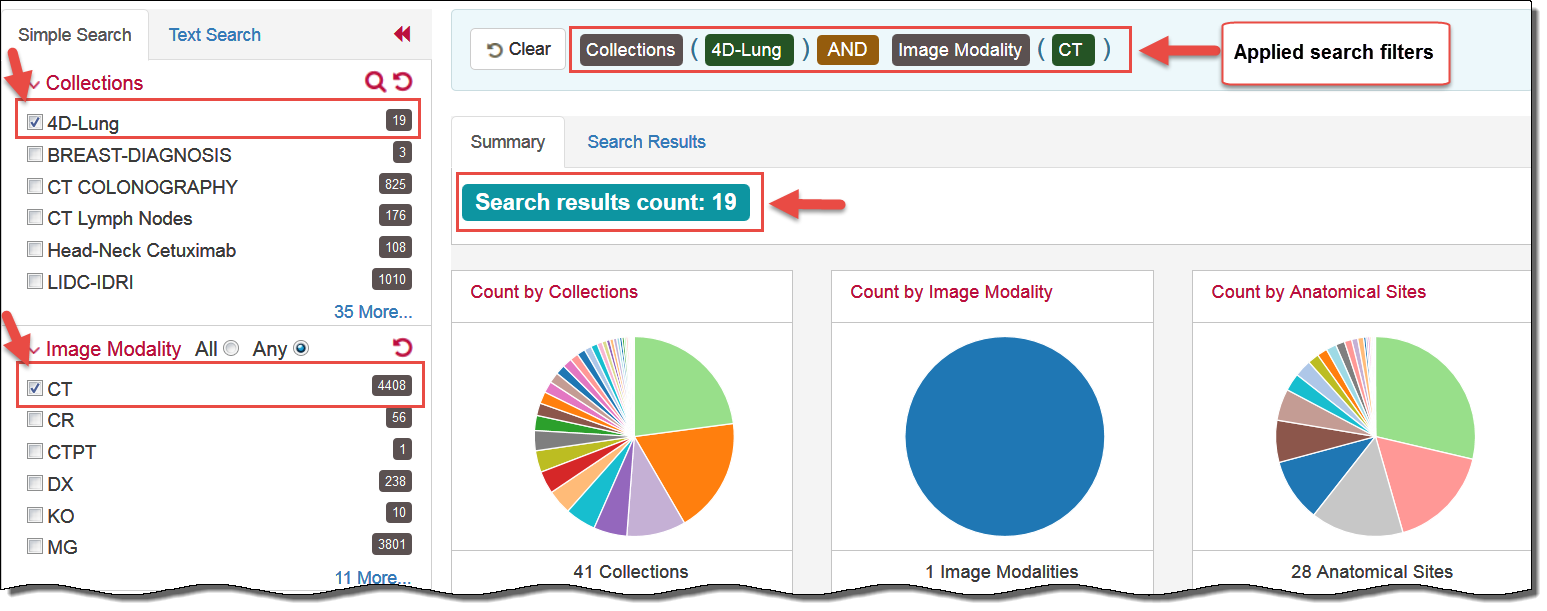
The pie charts show the count of image studies in your search results by Collection, Image Modality, and Anatomical Site. Click a pie slice or hover over it to see the name of the Collection, Image Modality, or Anatomical Site, and number of each, in your search results.

The Search Results tab shows the same results as the pie charts but in tabular form.
Text searches involve entering any text that might appear in any search filter.

Results are displayed in pie charts and a table, just as with the simple search.