The search results from your query are presented in a table with the search filters summarized at the top. Each record in the table corresponds to one subject (patient) and displays the collection(s), study(ies), and image series associated with that subject.
Click Result Charts to open a view of your search results in chart form. These charts show counts of collections, image modalities, and body part examined in the database. Each pie "slice" is a filter you can use to narrow the data in the portal. Hover over a pie chart slice to view the name of each filter. The size of each pie slice is relative to the size of that filter's representation in the database.

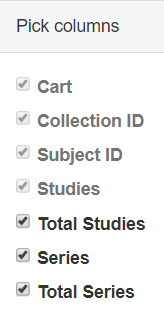
Select which columns you want to have appear in the table by clicking![]() at the top of the table. The Pick columns panel appears.
at the top of the table. The Pick columns panel appears.
The search results that match your criteria appear sorted by Patient ID. Click a Patient ID link to drill down into the subject details.

In this example, this patient (also called subject) is associated with four studies.
You can add all studies associated with a subject to your cart at the same time or drill down to an individual study and add it to your cart instead.
The red asterisk indicates that the date, which is the date that this series was first available at TCIA, has been offset to protect private health information.
Click the date or the arrow to the left of the study cart icon to view details about that study.
All of the image series associated with that study appear.

You can now:
- View the series description, modality, manufacturer, number of images, and series ID.
- Download study data.
- View thumbnails of the image series.
- View an animation of the image series.
- View DICOM data for this image series.