Summary
The utilization of synthetic nodules with known truth regarding size and location allows for bias and variance analysis, enabled by the acquisition of repeat CT scans. Using a factorial approach to probe imaging parameters (acquisition and reconstruction) and nodule characteristics (size, density, shape, location), ten repeat scans have been collected for each protocol and nodule layout. The resulting database of CT scans is incrementally becoming available to the public via The Cancer Imaging Archive (TCIA) to facilitate the assessment of lung nodule size estimation methodologies and the development of image analysis software among other possible applications.
Data Access
| Data Type | Download all or Query/Filter | License |
|---|---|---|
| Images (DICOM, 728.5 GB) | (Download requires the NBIA Data Retriever) | |
| DICOM Metadata Digest (CSV, 862 kB) |
Click the Versions tab for more info about data releases.
Additional Resources for this Dataset
The NCI Cancer Research Data Commons (CRDC) provides access to additional data and a cloud-based data science infrastructure that connects data sets with analytics tools to allow users to share, integrate, analyze, and visualize cancer research data.
- Imaging Data Commons (IDC) (Imaging Data)
Detailed Description
Collection Statistics | |
|---|---|
Modalities | CT |
Number of Participants | 7 |
Number of Studies | 76 |
Number of Series | 4,433 |
Number of Images | 1,468,751 |
| Image Size (GB) | 728.5 |
Database Description (link)
The anthropomorphic thoracic phantom (Kyotokagaku Incorporated, Tokyo, Japan) employed in this study is shown in Figure 1, along with the vasculature insert on which synthetic nodules were attached before CT imaging. The phantom does not contain lung parenchyma so the space within the vascular structure is filled with air.
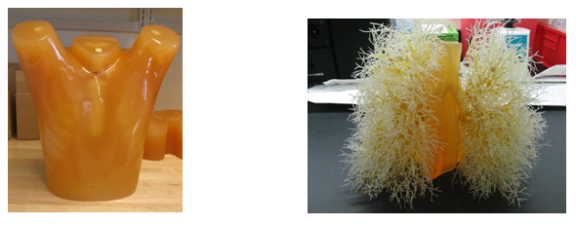
Fig 1: Photograph of the exterior shell of the thoracic phantom (left) and the vasculature insert (right).
The synthetic lung nodules used in our data CT scans were manufactured by either Kyotokagaku Incorporated (Japan) and Computerized Imaging Reference Systems (CIRS, Norfolk, VA). They consisted of objects varying in size (5, 8, 10, 12, 20, 40 mm), shape (spherical, elliptical, lobulated, spiculated), and density (-800, -630, -10, +100 HU). Figure 2 shows examples of the various sizes and shapes of synthetic nodules used in our CT data collection.
Eight different layouts of nodules were specified by placing them in premarked positions within the phantom vasculature, where they were either attached to vessels or suspended in foam (non-attached configuration). Care was taken to maintain constant positioning of the nodules when a particular layout was scanned multiple times or with different protocols. For that purpose, vessels on which nodules were attached were color coded. Table 1 tabulates the nodule configuration for the nodule layouts that are currently available at NBIA DICOM Radiology Portal in terms of nodule positioning, size, shape, and density. Figures 3-6 show a schematic diagram of the currently available layouts. All tables and figures in this document will be updated as more data is posted.
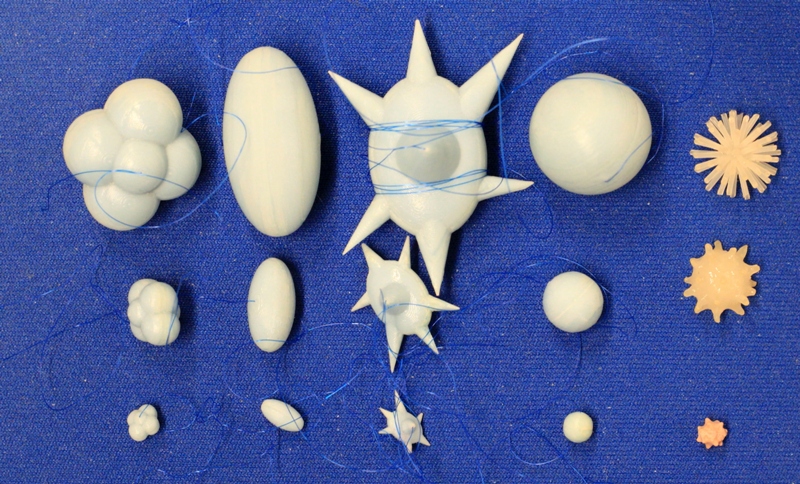
Figure 2: Photographs of the different types of synthetic nodules used in this study. Each column shows example nodules in three sizes, with lobulated, elliptical, spiculated, spherical, and irregular nodules shown from left to right. The three sizes shown here were manufactured to have the equivalent volumes of spherical nodules with diameters of 5, 10, and 20 mm (with the exception of the irregular shapes which have nominal diameters of about 5, 10, 12 mm). Additional nodules used in this study span the size range between 5-60mm.
Nodule layout | Vessel attachment | Nodule placement and description | |||||
Left lung | Right lung | ||||||
Nominal diameter (mm) | Shape*
| HU | Nominal diameter (mm) | Shape | HU | ||
1 | attached | 5,8,10 | SPH | -800 | 5,8,10 | SPH | -630 |
2 | attached | 5,8,10 | SPH | 100 | 8,12,15 | irregular | -300, 30,30 |
3 | attached | 5,8,10,20,40 | SPH | 100 | 5,8,10,20,40 | SPH | -630 |
4 | attached | 10, 20, 10, 20, 10, 20 | ELL, ELL, LOB, LOB, SPI, SPI | -630 | 10, 20, 10, 20, 10, 20 | ELL^, ELL, LOB, LOB, SPI, SPI | 100 |
Table 1. Summary of currently available nodule layouts. *SPH- spherical, ELL- elliptical, LOB- lobulated, SPI- spiculated. ^Note: The 10mm, 100HU elliptical nodule in the right lung has a large hole in it. A replacement was scanned as part of Nodule 6 which will be released by the end of 2014.
The phantom was scanned using a Philips 16-row scanner (Mx8000 IDT, Philips Healthcare, Andover, MA) and a Siemens 64-row scanner (Somatom Definition 64, Siemens Medical Solutions USA, Inc., Malvern, PA). Scans were acquired with varying combinations of effective dose, pitch, and slice collimation, and were reconstructed with varying combinations of slice thicknesses and reconstruction kernels. Ten exposures were acquired for each imaging protocol. The phantom position was not changed during the 10 repeat exposures; however it was repositioned between different imaging protocols or different nodule layouts. Table 2 summarizes the imaging protocols for the nodule layout.
NOTE: Each study in the database contains 10 repeat scans for that particular acquisition protocol, multiplied by the number of reconstructions. The study and series descriptions contain the following information:
Study description:
Contains information on: the scanner vendor (currently Philips or Siemens), the exposure (in mAs), the pitch (currently either 1.2 or 0.9 according to the definition , where Δd is the patient table travel in the horizontal direction and T is the detector width at the isocenter plane), and slice collimation (in mm).
Series description:
Contains information on reconstructed slice thickness (in mm), reconstructed slice increment (in mm), and reconstruction filter or kernel (currently either C for detail, or B for medium).
Nodule Layout, Scanner | Eff.dose (mAs) | Slice collimation (mm) | Slice overlap | Pitch | Recon. Slice thickness (mm) | Recon. Kernels | # sets |
1,S1 | 20,50,100,200 | 16x0.75, (16x1.5) | 50% | 0.9,1.2 | 0.75,1.5,3 (2,3,5) | C | 480 |
2, S1 | 20,100,200 | 16x0.75, (16x1.5) | 50% | 0.9,1.2 | 0.75,1.5,3 (2,3,5) | C, B | 720 |
3, S2 | 25, 100, 200 | 64x0.6 | 0%, 50% | 0.9, 1.2 | 0.75, 1.5, 3.0 | B40f, B60f | 720 |
4, S1 | 25, 100, 200 | 16x0.75, (16x1.5) | 50% | 0.9,1.2 | 0.75,1.5,3 (2,3,5) | C, B | 720 |
TOTAL | 2640 |
Table 2. Summary of reconstructed CT datasets: a description of the individual nodule layouts are provided in Table 3. *S1: 16-row Philips Mx8000 IDT (Philips Healthcare, Andover, MA), S2: 64-row Siemens Somatom (Siemens, Erlangen, Germany).
For example: there are 16 studies for Nodule Layout #1 (4 exposures x 2 slice collimations x 2 pitch settings). Each study contains 30 series (10 repeat scans x 3 reconstructed slice thickness x 1 reconstruction kernel).
A key component of the CT lung phantom project is the ability to compare the estimated nodule size with the known true size or reference gold standard. As part of our project, volume was used as a surrogate measure of size. The true volume estimate of each synthetic nodule was derived from weight and density measures. Both the CIRS-and Kyotokagaku nodules were accompanied by density measures. Nodule weights were measured in our lab using a precision scale of 0.1 mg tolerance (Adventurer Pro AV 2646, Ohaus Corp, Pine Brook, NJ). Three repeat weight measurements were made and these weights were averaged to produce a final estimated weight for each nodule. Our estimates of the true volume of the synthetic nodules in each layout are summarized in Table 3 along with approximated xyz location (based on 0.8mm slice thickness) of nodule center in the CT scans.
This phantom and the associated synthetic nodules designed in our lab have been used in a number of studies examining the accuracy and precision of volumetric measurements using CT
Nodule Layout | Right lung nodules | Left lung nodules | |||||||||
Nom. Diam.(mm) | Shape | HU | x y z | Vol (µl) | Nom. Diam. (mm) | Shape | HU | x y z | Vol (µl) | ||
1 | 5 | SPH | -630 | 177 342 192 | 71 | 5 | SPH | -800 | 340 325 168 | 62 | |
8 | SPH | -630 | 179 288 531 | 282 | 8 | SPH | -800 | 343 274 540 | 245 | ||
10 | SPH | -630 | 170 309 385 | 522 | 10 | SPH | -800 | 394 260 363 | 496 | ||
2 | 8 | irr | -300 | 184 290 525 | 253 | 5 | SPH | 100 | 335 331 157 | 64 | |
12 | irr | 30 | 170 319 379 | 676 | 8 | SPH | 100 | 351 282 538 | 255 | ||
15 | irr | 30 | 189 347 161 | 263 | 10 | SPH | 100 | 395 276 349 | 506 | ||
3 | 5 | SPH | -630 | 192 350 562 | 71 | 5 | SPH | 100 | 338 328 580 | 64 | |
8 | SPH | -630 | 185 287 208 | 282 | 8 | SPH | 100 | 355 278 212 | 255 | ||
10 | SPH | -630 | 170 324 354 | 522 | 10 | SPH | 100 | 394 270 390 | 506 | ||
20 | SPH | -630 | 157 251 190 | 4193 | 20 | SPH | 100 | 384 240 229 | 4215 | ||
40 | SPH | -630 | 168 280 198 | 34524 | 40 | SPH | 100 | 373 262 156 | 33781 | ||
4 | 10 | ELL | -630 | 176 354 178 | 547 | 10 | ELL | 100 | 341 333 162 | 545 | |
20 | ELL | -630 | 169 322 95 | 4210 | 20 | ELL | 100 | 401 296 122 | 4155 | ||
10 | LOB | -630 | 159 329 347 | 530 | 10 | LOB | 100 | 395 272 329 | 535 | ||
20 | LOB | -630 | 136 292 337 | 4305 | 20 | LOB | 100 | 349 350 268 | 4441 | ||
10 | SPI | -630 | 167 315 520 | 539 | 10 | SPI | 100 | 357 296 530 | 535 | ||
20 | SPI | -630 | 133 269 475 | 4335 | 20 | SPI | 100 | 386 248 503 | 4305 | ||
Table 3. Approximate center location and estimated true volume of synthetic lung nodules in each nodule layout based on 0.75mm slice thickness, 0.4mm slice increment CT scans. (SPH=spherical, ELL=elliptical, LOB= lobulated, SPI= spiculated, irr=irregular)
Please contact help@cancerimagingarchive.net who can direct you to Dr. Gavrielides with further scientific questions.
Appendix 1
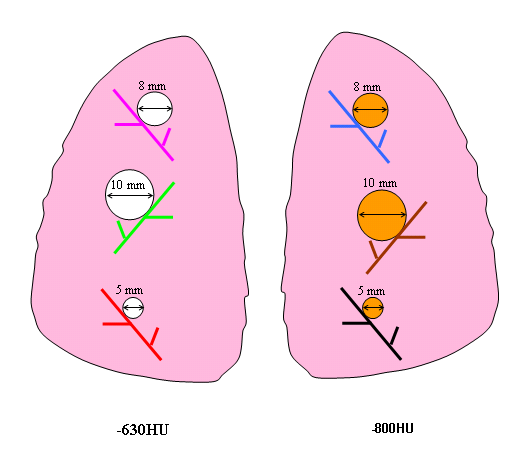
Figure 3. Schematic diagram of Nodule Layout#1 in terms of nodule placement. Vessel branches within the anthropomorphic phantom were color coded for the purpose of mapping nodules to specific positions within the phantom’s vasculature structure in a reproducible manner.
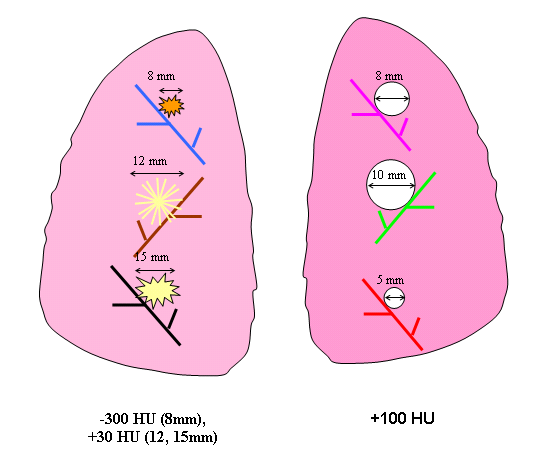
Figure 4. Schematic diagram of Nodule Layout#2 in terms of nodule placement.
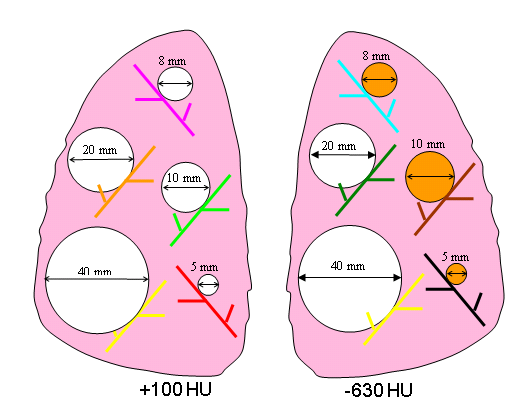
Figure 5. Schematic diagram of Nodule Layout#3 in terms of nodule placement.
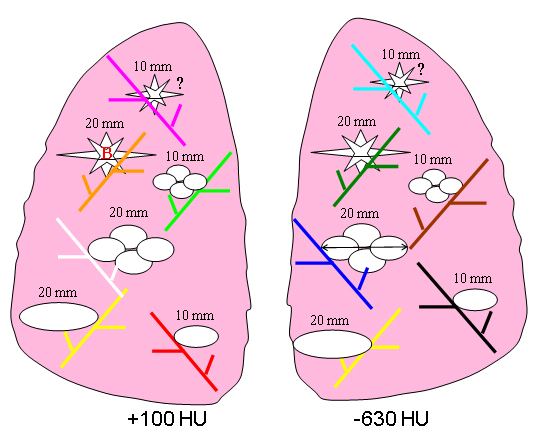
Figure 6. Schematic diagram of Nodule Layout#4 in terms of nodule placement.
Citations & Data Usage Policy
Users must abide by the TCIA Data Usage Policy and Restrictions. Attribution should include references to the following citations:
Data Citation
Gavrielides, M. A., Kinnard, L. M., Myers, K. J., Peregoy, J., Pritchard, W. F., Zeng, R., Esparza, J., Karanian, J., & Petrick, N. (2015). Data From Phantom FDA [Data set]. The Cancer Imaging Archive. https://doi.org/10.7937/k9/TCIA.2015.orbjkmux
Publication Citation
TCIA Citation
Clark, K., Vendt, B., Smith, K., Freymann, J., Kirby, J., Koppel, P., Moore, S., Phillips, S., Maffitt, D., Pringle, M., Tarbox, L., & Prior, F. (2013). The Cancer Imaging Archive (TCIA): Maintaining and Operating a Public Information Repository. In Journal of Digital Imaging (Vol. 26, Issue 6, pp. 1045–1057). https://doi.org/10.1007/s10278-013-9622-7
Questions may be directed to help@cancerimagingarchive.net.
Other Publications Using This Data
TCIA maintains a list of publications which leverage our data. If you have a manuscript you'd like to add please contact TCIA's Helpdesk.
- Kalpathy-Cramer, J., et al, (2016) "Radiomics of Lung Nodules: A Multi-Institutional Study of Robustness and Agreement of Quantitative Imaging Features." Tomography 2(4)430-437. doi: 10.18383/j.tom.2016.00235
- Peskin AP, Dima AA, Saiprasad G. An Automated Method for Locating Phantom modules in Anthropomorphic Thoracic Phantom CT Studies. The 2012 International Conference on Image Processing, Computer Vision, and Pattern Recognition. 2012. (IPC conference link)
Version 2 (Current): Updated 2017/08/30
| Data Type | Download all or Query/Filter |
|---|---|
| Images (DICOM, 728.5 GB) | (Download requires the NBIA Data Retriever) |
| DICOM Metadata Digest (CSV) | |
| Updated Description (.DOC) |
Version 1: Updated 2014/08/04
| Data Type | Download all or Query/Filter |
|---|---|
| Images (DICOM, 125.4GB) | |
| DICOM Metadata Digest (CSV) |