Detailed DescriptionCollection Statistics |
|
|---|
Modalities | MR, CT | Number of Patients | 123 | Number of Studies | 566 | Number of Series | 7629 | Number of Images | 717,070 | | Image Size (GB) | 86.9 |
Study Accrual: Of the 123 patients enrolled on the study, 107 had baseline and at least 1 post-treatment MRI and were evaluable for the primary aims. Imaging Protocol: The MR imaging protocol is divided into two sections: Standard and Advanced. The Standard protocol acquires a pre-contrast T1-weighted, a T2-weighted, a FLAIR and a diffusion-weighted imaging series all in the axial plane. After intravenous injection of 0.1 mmol/kg of standard gadolinium-based agent, axial 2D spin-echo (2D-T1) and 3D volumetric (3D-T1) T1-weighted (post-Gd) images were acquired. The advanced scheme acquires the following series: a T1 mapping sequence with flip angles at 2°, 5°, 10°, 15°, 25°, a dynamic contrast-enhanced T1, a dynamic susceptibility contrast diffusion weighted series and/or a MR spectroscopy 2D CSI PRESS sequence. Complete MRI parameters for this protocol are listed on the ACRIN website http://www.acrin.org/6677_protocol.aspx, see the Imaging Transmittal Worksheet and Parameters in the Imaging Materials link. Image Analysis: Two central neuroradiologists serially measured bi-dimensional (2D) and volumetric (3D) enhancement on post-contrast T1-weighted images and volume of FLAIR hyperintensity on 107 evaluable patients. For the MR spectroscopy analysis, 13 patients who had baseline and subsequent MRS were analyzed. Spectra from the enhancing tumor and peri-tumoral regions were defined on the post-contrast T1-weighted images. Changes in the concentration ratios of n-acetylaspartate/creatine (NAA/Cr), choline-containing compounds (Cho)/Cr, and NAA/Cho were quantified in comparison with pretreatment values. Outcomes: Outcome, like progression status, on all post-treatment MRIs was determined using Macdonald and RANO imaging threshold criteria, with a third neuroradiologist adjudicating discrepancies of both progression occurrence and timing. For each MRI pulse sequence, Kaplan-Meier survival estimates and log-rank test were used to compare OS between cases with or without radiologic progression. Results indicated that early progression on 2D-T1 and 3D-T1, but not FLAIR MRI, after 8 and 16 weeks of anti-vascular endothelial growth factor therapy has highly significant prognostic value for OS in recurrent GBM. For MR spectroscopy, NAA/Cho levels increased and Cho/Cr levels decreased within enhancing tumor at 2 weeks relative to pretreatment levels. Decreased Cho/Cr and increased NAA/Cr and NAA/Cho in tumor periphery at 16 weeks posttreatment were associated with both 6-month progression-free survival and 1-year survival. Date Offsets: All dates, like the visit date, are protected by presenting just the year; however, dates are also listed as offset days from the base date. The offset dates are used as a means of protecting patient information provided by the local sites in the original data, while allowing users to determine intervals between events. The standard DICOM date tags (i.e. birth dates, imaging study dates, etc.) have been de-identified so that all patients have a baseline study date of January 1, 1960. This falsified date represents the day patients were entered into trial database. The number of days between a subject’s longitudinal imaging studies are accurately preserved. A patient with a study performed on January 4, 1960 means the images were collected 3 days after the base date. For convenience, this calculation has been performed for all scans with the results inserted in DICOM tag (0012,0050) Clinical Trial Time Point ID. This means an imaging study that took place on January 4, 1960 would contain a value of "3" in tag (0012,0050). Schema 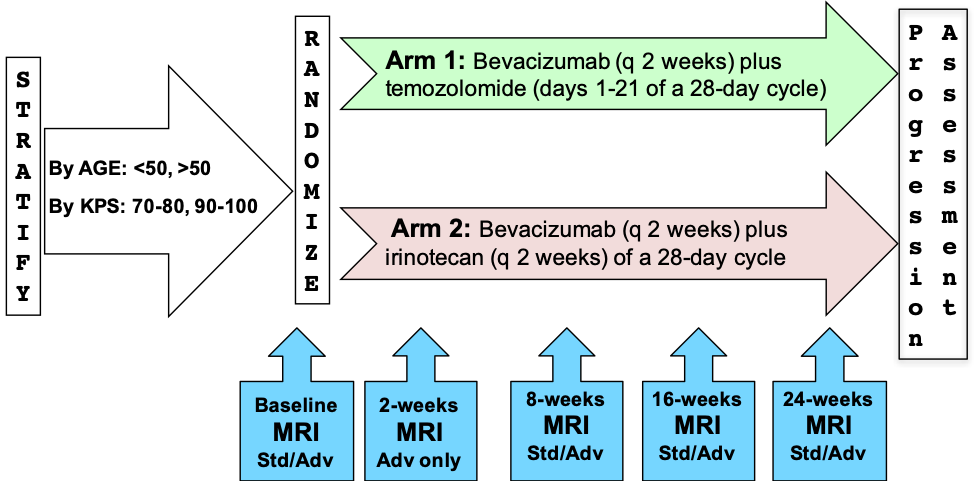
Please refer to the imaging protocol for the definitions of standard (Std) and advanced (Adv) MR imaging. Assessment of progression was determined by Macdonald and RANO criteria. | 
