Summary
RTOG 0625/ACRIN 6677 is a multicenter, randomized, phase II trial of bevacizumab with irinotecan or temozolomide in recurrent glioblastoma (GBM). This study investigated whether early posttreatment progression on FLAIR or postcontrast MRI assessed by central reading predicts overall survival (OS).
METHODS:
Of 123 enrolled patients, 107 had baseline and at least 1 posttreatment MRI. Two central neuroradiologists serially measured bidimensional (2D) and volumetric (3D) enhancement on postcontrast T1-weighted images and volume of FLAIR hyperintensity. Progression status on all posttreatment MRIs was determined using Macdonald and RANO imaging threshold criteria, with a third neuroradiologist adjudicating discrepancies of both progression occurrence and timing. For each MRI pulse sequence, Kaplan-Meier survival estimates and log-rank test were used to compare OS between cases with or without radiologic progression.
Two sets of XLS spreadsheets (ACRIN-DSC-MR-Brain TCIA Anonymized and ACRIN-DSC-MR-Brain-HB TCIA Anonymized) are needed in order to obtain the entire clinical data set for this collection. The file sets are a random sample of ACRIN 6677 participants divided into 2 groups. Group 1/ACRIN-DSC-MR-Brain TCIA Anonymized: a 75% random sample; Group 2/ACRIN-DSC-MR-Brain-HB TCIA Anonymized: a 25% random sample initially held for testing/validating algorithms trained on the 75% sample. Both are available via the clinical download button.
RESULTS:
Radiologic progression occurred after 2 chemotherapy cycles (8 weeks) in 9 of 97 (9%), 9 of 73 (12%), and 11 of 98 (11%) 2D-T1, 3D-T1, and FLAIR cases, respectively, and 34 of 80 (43%), 21 of 58 (36%), and 37 of 79 (47%) corresponding cases after 4 cycles (16 weeks). Median OS among patients progressing at 8 or 16 weeks was significantly less than that among nonprogressors, as determined on 2D-T1 (114 vs 278 days and 214 vs 426 days, respectively; P < .0001 for both) and 3D-T1 (117 vs 306 days [P < .0001] and 223 vs 448 days [P = .0003], respectively) but not on FLAIR (201 vs 276 days [P = .38] and 303 vs 321 days [P = .13], respectively).
CONCLUSION:
Early progression on 2D-T1 and 3D-T1, but not FLAIR MRI, after 8 and 16 weeks of anti-vascular endothelial growth factor therapy has highly significant prognostic value for OS in recurrent GBM.
Acknowledgements
This shared data set was provided in collaboration with the American College of Radiology Core Lab. Many thanks are due to the ACRIN 6667 trial team, and all the patients participating in the study. This study was supported by the American College of Radiology Imaging network (ACRIN), which received funding from the National Cancer Institute through UO1 CA080098, U01 CA190254 and R50 CA211270 (Muzi), under the American Recovery and Reinvestment ACT of 2009 (ARRA) and UO1 CA079778.
Please see QIN ECOG-ACRIN Data Sharing page for an overview and list of other ECOG-ACRIN data collections available on TCIA.
Data Access
| Data Type | Download all or Query/Filter | License |
|---|---|---|
Images (DICOM, 86.9 GB) | (Download requires NBIA Data Retriever) | |
| Clinical (XLS, zip, 2.20 MB) |
Click the Versions tab for more info about data releases.
Detailed Description
Collection Statistics | |
|---|---|
Modalities | CT, MR |
Number of Participants | 123 |
Number of Studies | 566 |
Number of Series | 7629 |
Number of Images | 717,070 |
| Image Size (GB) | 86.9 |
Study Accrual:
Of the 123 patients enrolled on the study, 107 had baseline and at least 1 post-treatment MRI and were evaluable for the primary aims.
Imaging Protocol:
The MR imaging protocol is divided into two sections: Standard and Advanced. The Standard protocol acquires a pre-contrast T1-weighted, a T2-weighted, a FLAIR and a diffusion-weighted imaging series all in the axial plane. After intravenous injection of 0.1 mmol/kg of standard gadolinium-based agent, axial 2D spin-echo (2D-T1) and 3D volumetric (3D-T1) T1-weighted (post-Gd) images were acquired.
The advanced scheme acquires the following series: a T1 mapping sequence with flip angles at 2°, 5°, 10°, 15°, 25°, a dynamic contrast-enhanced T1, a dynamic susceptibility contrast diffusion weighted series and/or a MR spectroscopy 2D CSI PRESS sequence.
Image Analysis:
Two central neuroradiologists serially measured bi-dimensional (2D) and volumetric (3D) enhancement on post-contrast T1-weighted images and volume of FLAIR hyperintensity on 107 evaluable patients. For the MR spectroscopy analysis, 13 patients who had baseline and subsequent MRS were analyzed. Spectra from the enhancing tumor and peri-tumoral regions were defined on the post-contrast T1-weighted images. Changes in the concentration ratios of n-acetylaspartate/creatine (NAA/Cr), choline-containing compounds (Cho)/Cr, and NAA/Cho were quantified in comparison with pretreatment values.
Outcomes:
Outcome, like progression status, on all post-treatment MRIs was determined using Macdonald and RANO imaging threshold criteria, with a third neuroradiologist adjudicating discrepancies of both progression occurrence and timing. For each MRI pulse sequence, Kaplan-Meier survival estimates and log-rank test were used to compare OS between cases with or without radiologic progression. Results indicated that early progression on 2D-T1 and 3D-T1, but not FLAIR MRI, after 8 and 16 weeks of anti-vascular endothelial growth factor therapy has highly significant prognostic value for OS in recurrent GBM. For MR spectroscopy, NAA/Cho levels increased and Cho/Cr levels decreased within enhancing tumor at 2 weeks relative to pretreatment levels. Decreased Cho/Cr and increased NAA/Cr and NAA/Cho in tumor periphery at 16 weeks posttreatment were associated with both 6-month progression-free survival and 1-year survival.
Date Offsets:
All dates, like the visit date, are protected by presenting just the year; however, dates are also listed as offset days from the base date. The offset dates are used as a means of protecting patient information provided by the local sites in the original data, while allowing users to determine intervals between events. The standard DICOM date tags (i.e. birth dates, imaging study dates, etc.) have been de-identified so that all patients have a baseline study date of January 1, 1960. This falsified date represents the day patients were entered into trial database. The number of days between a subject’s longitudinal imaging studies are accurately preserved. A patient with a study performed on January 4, 1960 means the images were collected 3 days after the base date. For convenience, this calculation has been performed for all scans with the results inserted in DICOM tag (0012,0050) Clinical Trial Time Point ID. This means an imaging study that took place on January 4, 1960 would contain a value of "3" in tag (0012,0050).
Schema
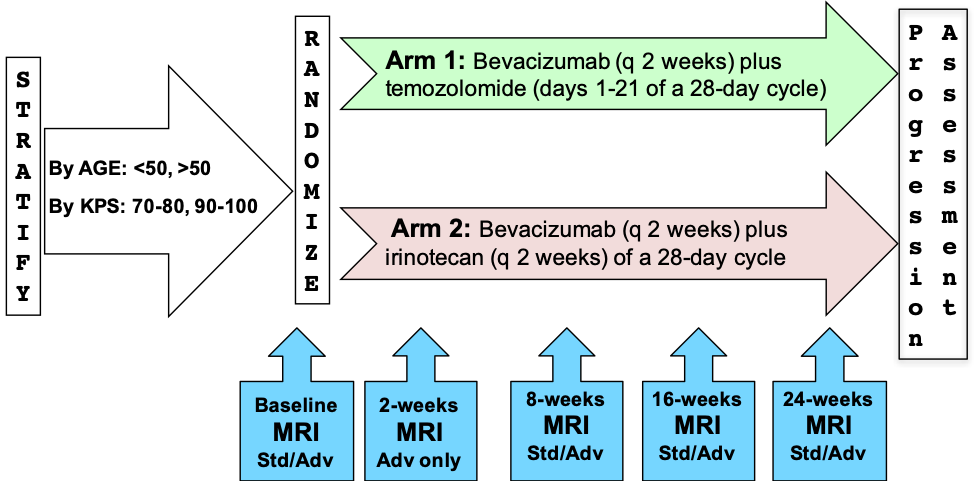
Please refer to the imaging protocol for the definitions of standard (Std) and advanced (Adv) MR imaging. Assessment of progression was determined by Macdonald and RANO criteria.
Overview of Clinical Data
The basic data flow for legacy ACRIN multi-center clinical trials was that all clinical information provided by the local imaging sites were contained in a series of forms. The form data submitted by local investigators to ACRIN during and after the trial, were manually encoded into the ACRIN CTMS (Clinical Trial Management System), and were cross-checked for accuracy by ECOG-ACRIN personnel. These ACRIN 6677 forms (see the ACRIN 6677 Data Forms page), filled out by the local sites, deliver information on imaging, clinical management of the patient and pathology/outcome variables, like dates of progression and survival, along with other critical information. The image data was initially anonymized while uploading from the local sites through TRIAD software and archived in a DICOM database at ACRIN.
After the trial accrual had ended, the clinical data was sent to the Brown statistical center, that is funded by NCI to provide support for ECOG-ACRIN clinical trials, specifically for analysis of the primary and sometimes secondary aims of the trial. The statisticians at Brown strip all the actual dates, names and other PHI from the CTMS data and create a .csv file for each form that has selected information useful for analysis of the trial data. A Form Description file detailing all the forms used in the study accompanies the .csv data files. Additionally, the accompanying Data Dictionary file lists each element for each form that has been selected for data retention along with a description of each form element.
Extracting clinical (non-imaging) data example:
Beginning with the Form Description.csv file, select the form with the desired information needed, such as form A0.csv the patient Eligibility/Registration form. Next, using the Data Dictionary.csv file, find the form elements listed for A0 (eg., A0exx, where xx is the form element number). The file lists the form number, variable name, its description or label, the type of data, and, when applicable, the option codes and corresponding text values (option code:description pairs like 1=’No’, 2=’Yes’; or 1=’Baseline’, 2=’Post treatment’) for each data element available from the form. In the example in Figure 2, the A0 form element 31d (A0e31d) reports the days between the base date and the day of surgery for the patient. In the corresponding A0.csv file column G lists the days between the base date and surgery for each patient.
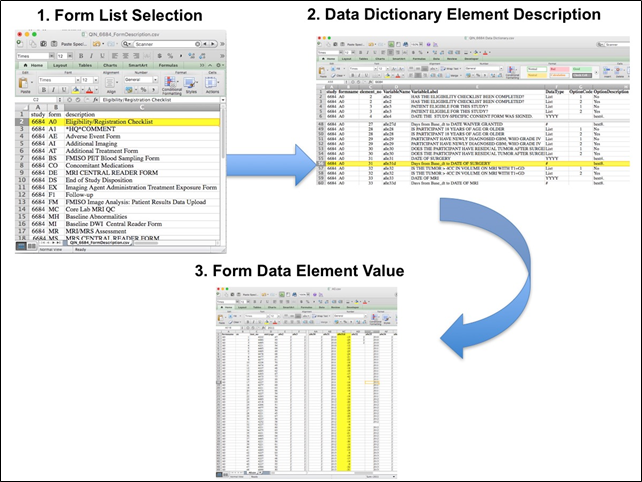
In this example of extracting clinical data, the first step is to 1) find the form from the form list, 2) Find the desired element and description in the Data Dictionary and finally 3) extract the values from the .csv data file.
The procedure above is basically how the statisticians organized the selected data for export, but the structure of the data dictionaries and individual forms are different for each clinical trial.
Citations & Data Usage Policy
Users must abide by the TCIA Data Usage Policy and Restrictions. Attribution should include references to the following citations:
Data Citation
Kinahan, P., Muzi, M., Bialecki, B., Herman, B., & Coombs, L. (2019). Data from ACRIN-DSC-MR-Brain [Data set]. The Cancer Imaging Archive. DOI: https://doi.org/10.7937/tcia.2019.zr1pjf4i.
Publication Citation
Boxerman JL, Zhang Z, Safriel Y, Larvie M, Snyder BS, Jain R, Chi TL, Sorensen AG, Gilbert MR, Barboriak DP. (2013) Early post-bevacizumab progression on contrast-enhanced MRI as a prognostic marker for overall survival in recurrent glioblastoma: results from the ACRIN 6677/RTOG 0625 Central Reader Study. Neuro Oncol. 15:945-954. DOI: 10.1093/neuonc/not049.
TCIA Citation
Clark K, Vendt B, Smith K, Freymann J, Kirby J, Koppel P, Moore S, Phillips S, Maffitt D, Pringle M, Tarbox L, Prior F. (2013) The Cancer Imaging Archive (TCIA): Maintaining and Operating a Public Information Repository, Journal of Digital Imaging, Volume 26, Number 6, pp 1045-1057. DOI: 10.1007/s10278-013-9622-7
Other Publications Using This Data
TCIA maintains a list of publications which leverage our data. If you have a publication you'd like to add please contact the TCIA Helpdesk.
Version 1 (Current): Updated 2019/02/07
| Data Type | Download all or Query/Filter |
|---|---|
Images (DICOM, 86.9 GB) | (Download requires NBIA Data Retriever App) |
| Clinical (XLS) |
Two sets of XLS spreadsheets (ACRIN-DSC-MR-Brain TCIA Anonymized and ACRIN-DSC-MR-Brain-HB TCIA Anonymized) are needed in order to obtain the entire clinical data set for this collection. The file sets are a random sample of ACRIN 6677 participants divided into 2 groups. Group 1/ACRIN-DSC-MR-Brain TCIA Anonymized: a 75% random sample; Group 2/ACRIN-DSC-MR-Brain-HB TCIA Anonymized: a 25% random sample initially held for testing/validating algorithms trained on the 75% sample. Both are available via the clinical download button.