Summary
| Excerpt | ||||||
|---|---|---|---|---|---|---|
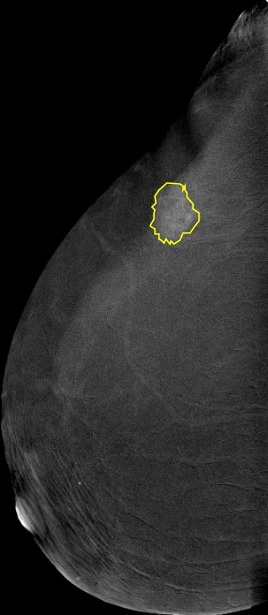
Acquisition protocol:CESM is done using the standard digital mammography equipment, with additional software that performs dual-energy image acquisition. Two minutes after intravenously injecting the patient with non-ionic low-osmolar iodinated contrast material (dose: 1.5 mL/kg), craniocaudal (CC) and mediolateral oblique (MLO) views are obtained. Each view comprises two exposures, one with low energy (peak kilo-voltage values ranging from 26 to 31kVp) and one with high energy (45 to 49 kVp). Low and high-energy images are then recombined and subtracted through appropriate image processing to suppress the background breast parenchyma. A complete examination is carried out in about 5-6 minutes. Image preprocessing:The images were converted from DICOM to JPEG using RadiAnt with best 100% image quality (lossless). They have an average of 2355 x 1315 pixels. Supporting data:Full medical reports are also provided for each case (DOCX) along with manual segmentation annotation for the abnormal findings in each image (CSV file). Each image with its corresponding manual annotation (breast composition, mass shape, mass margin, mass density, architectural distortion, asymmetries, calcification type, calcification distribution, mass enhancement pattern, non-mass enhancement pattern, non-mass enhancement distribution, and overall BIRADS assessment) is compiled into 1 Excel file. https://www.robots.ox.ac.uk/~vgg/software/via/via.html was used for the segmentation annotation. It can be used to show the annotations on the images by clicking on Annotation--> import annotations (from csv), and then proceeding to upload any image to view the annotations drawn over it. Moreover, a helper repository is created to help with pre-processing, model training, model evaluation, and segmentation annotation loading: https://github.com/omar-mohamed/CDD-CESM-Dataset Regarding the tabs on the annotations Excel file, these are commonly used radiological descriptors as defined by the American College of Radiology 2013 lexicon. |
...
