| Column | ||||||||
|---|---|---|---|---|---|---|---|---|
| ||||||||
Summary
|
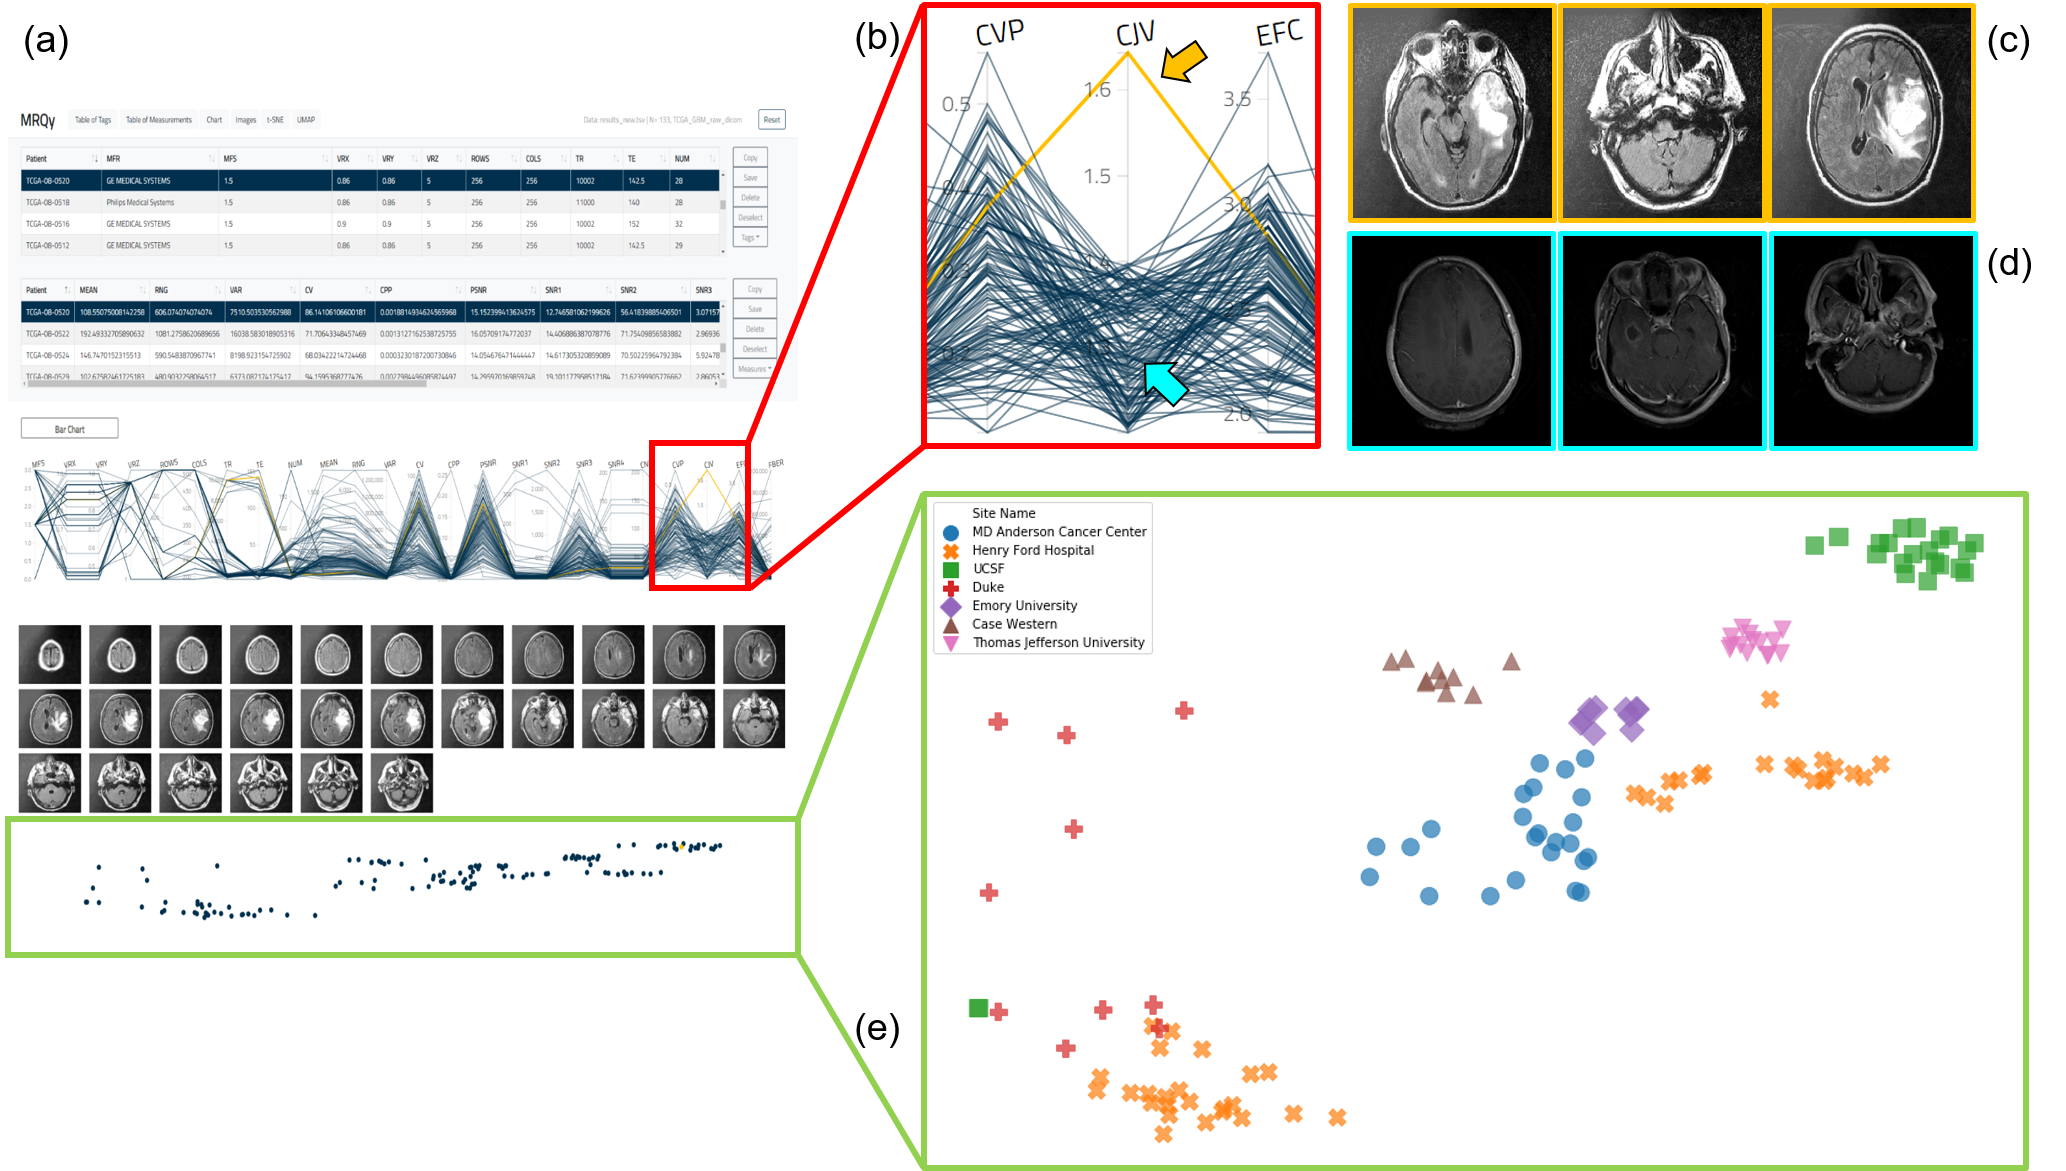
(a) MRQy front-end interface for interrogating TCGA-GBM cohort. (b) Outlier dataset identified on the parallel coordinate chart for the CJV quality measure found to exhibit shading artifacts on (c) representative images, especially when compared to (d) a different dataset without this artifact. (e) t-SNE scatter plot of quality measures revealing presence of site-specific batch effects (colors correspond to different sites, note presence of site-specific clusters).
AcknowledgementsResearch reported in this publication was supported by:
|
| Column |
|---|
 (a) MRQy front-end interface for interrogating TCGA-GBM cohort. (b) Outlier dataset identified on the parallel coordinate chart for the CJV quality measure found to exhibit shading artifacts on (c) representative images, especially when compared to (d) a different dataset without this artifact. (e) t-SNE scatter plot of quality measures revealing presence of site-specific batch effects (colors correspond to different sites, note presence of site-specific clusters). |
| Localtab Group | |||||||||||||||||||||||||||||||||||||||||||||||||||||||||||||||||||||||||||||||||||||||||||||||||||||
|---|---|---|---|---|---|---|---|---|---|---|---|---|---|---|---|---|---|---|---|---|---|---|---|---|---|---|---|---|---|---|---|---|---|---|---|---|---|---|---|---|---|---|---|---|---|---|---|---|---|---|---|---|---|---|---|---|---|---|---|---|---|---|---|---|---|---|---|---|---|---|---|---|---|---|---|---|---|---|---|---|---|---|---|---|---|---|---|---|---|---|---|---|---|---|---|---|---|---|---|---|---|
|