The following serves as a tutorial to those unfamiliar with 3D Slicer who wish to visualize the 3D segmentation data (NRRD) associated with the Prostate-Diagnosis collection. This tutorial assumes you have already downloaded the images and associated NRRD data from TCIA. If you need assistance obtaining these please go back to the Prostate-Diagnosis wiki page for more information on this topic.
Installing 3D Slicer
Browse to http://download.slicer.org/ and install the appropriate pre-compiled binary for your system (Windows, Mac, Linux - 32 or 64bit). The stable release is preferred to the nightly build.
Loading the DICOM data
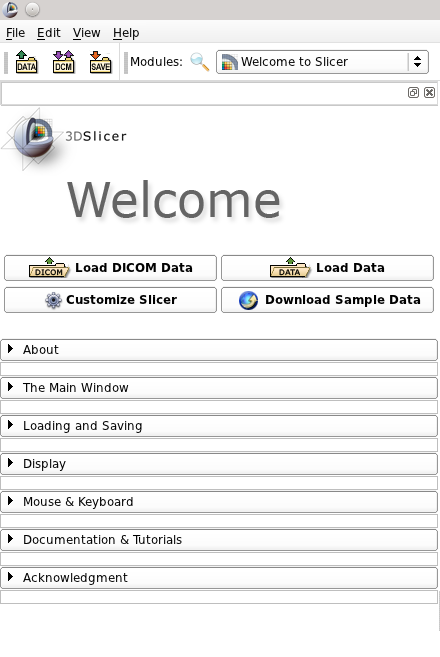
Upon starting Slicer you will be presented with the "Welcome to Slicer" module and the Conventional viewing layout. From here, click the "Load DICOM Data Button".
You will be presented with the DICOM Details window. Click the button next to "LocalDatabase" and select a folder for Slicer to use for keeping track of your DICOM data. Then Click the "Import" button.
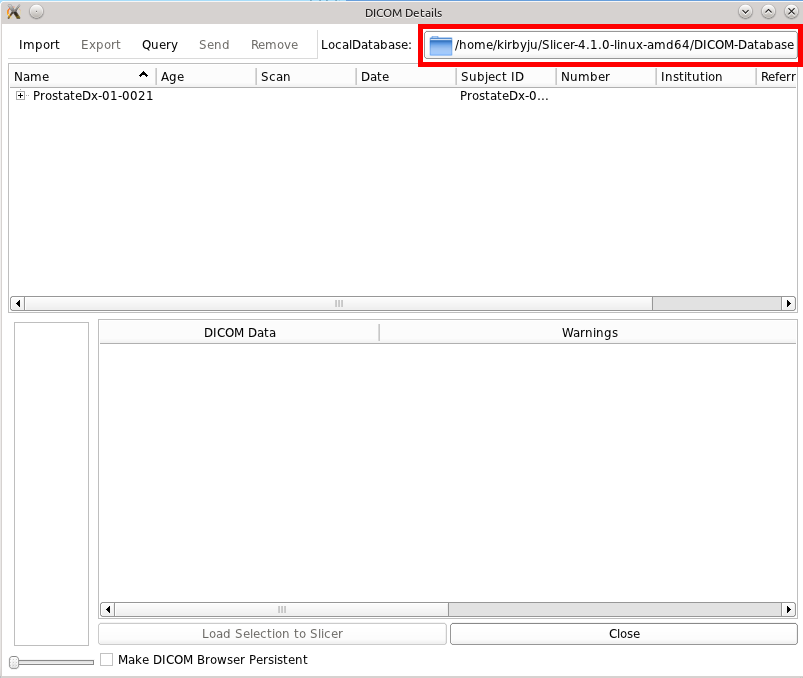
Navigate to wherever you saved the DICOM data from TCIA. Select the "Prostate-Diagnosis" directory and click "Import". You should now see the DICOM data in your "DICOM Details" screen. Drill down into the available data and select the T2W_TSE_AX from the patient you wish to analyze. Then click the "Load Selection to Slicer" button.

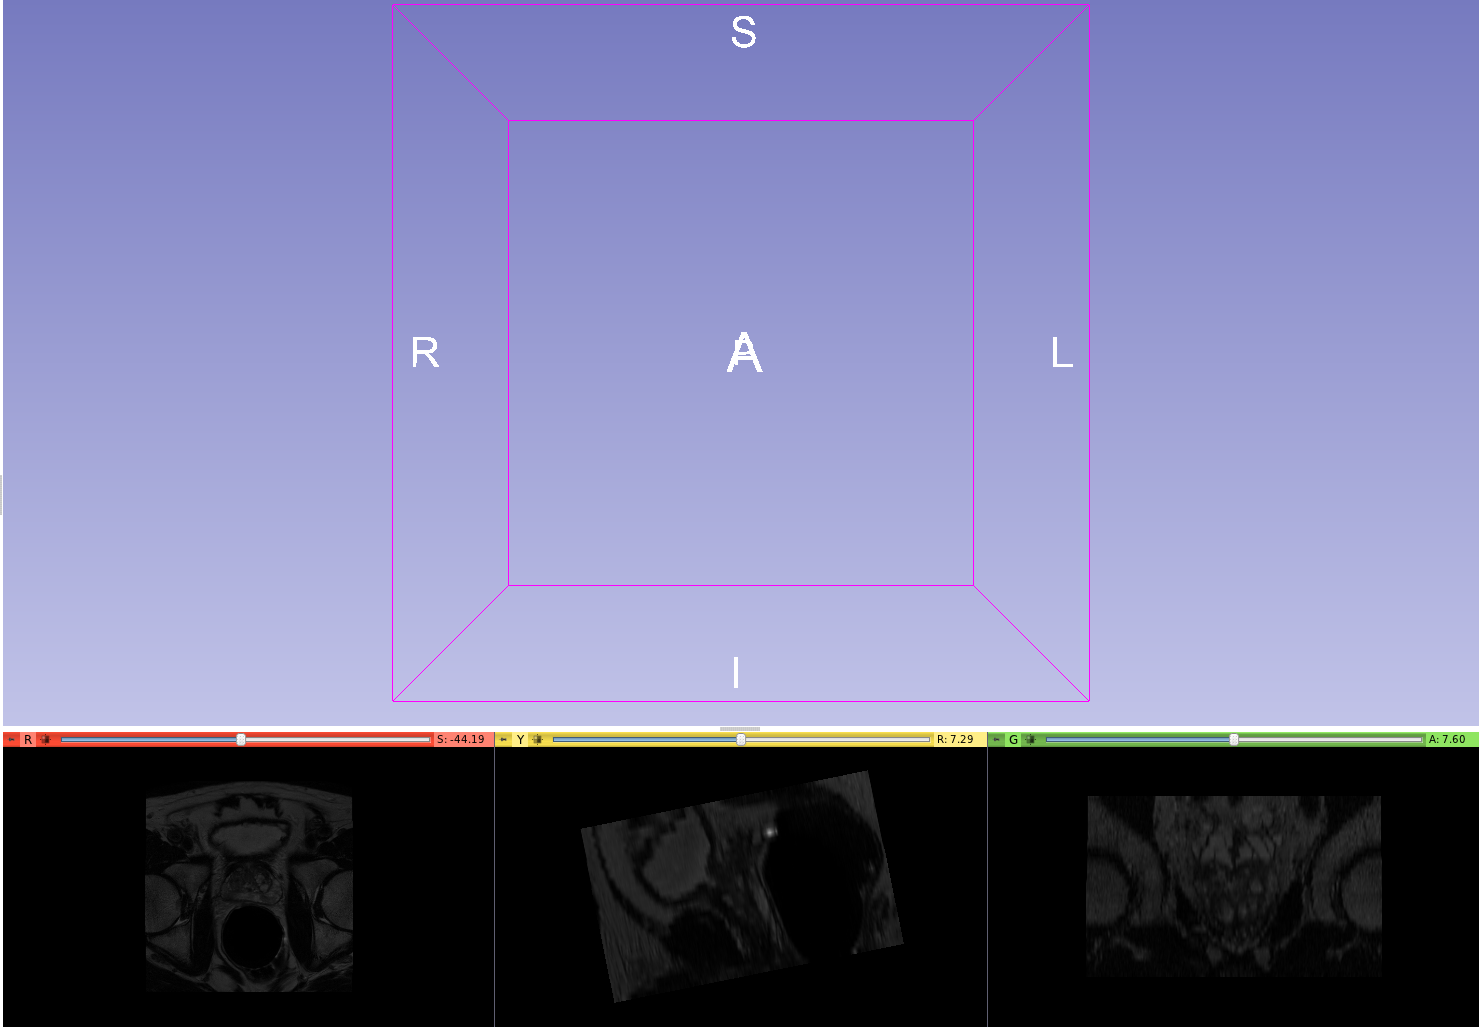
You should now see the DICOM data in the 3 smaller viewing areas. You can adjust the window level by clicking and holding the left mouse button and moving your mouse. You can also zoom in or out in the same way with the right mouse button.
Loading the NRRD segmentation
The next step is to import the NRRD segmentation and generate a 3D model. First you must go to the "File" menu and choose "Add Data".

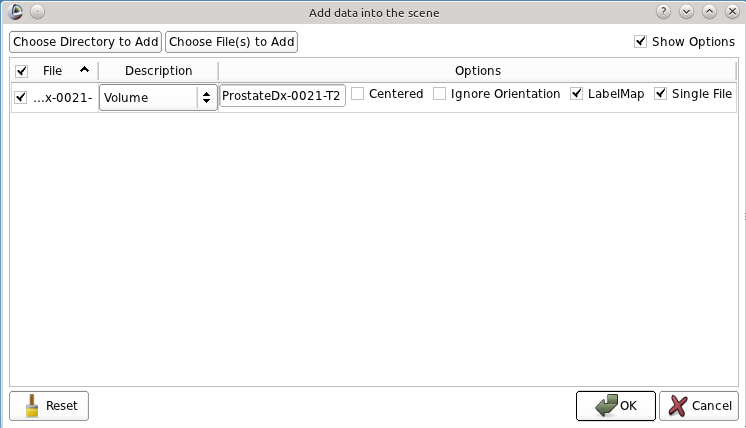
Next click "Choose File(s) to Add" and navigate to where you saved the NRRD data. Locate the NRRD file associated with the patient whose DICOM data you loaded in the earlier steps and click "Open". You should now see the NRRD file listed as a volume. Next, click the "Show Options" box in the top right corner of the dialog box and check the "LabelMap" option that appears. Then click "OK".
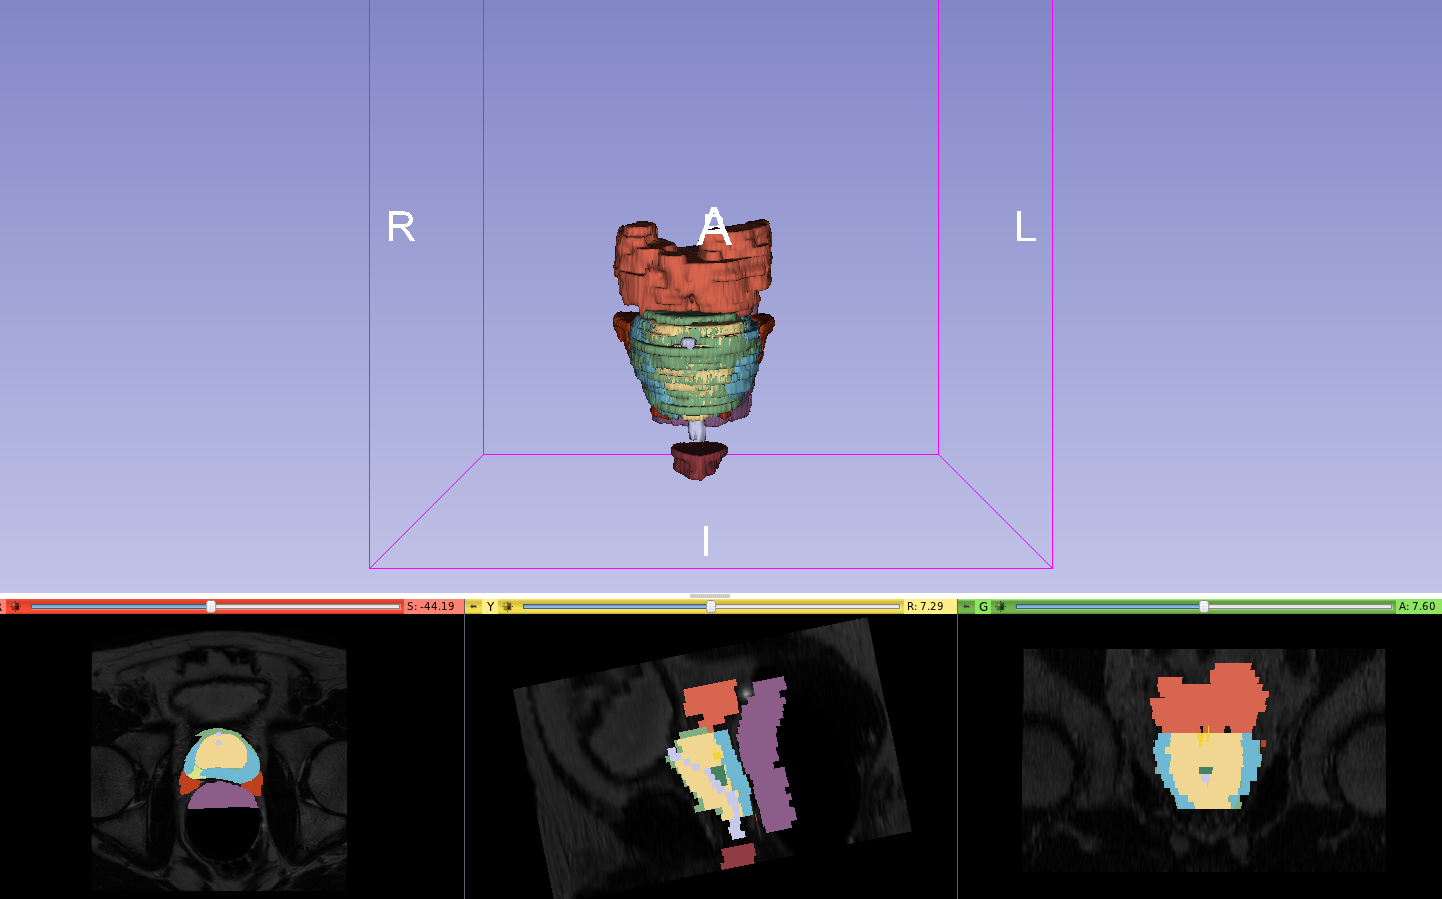
You should now see the colorized label maps appear as an overlay on the 2D DICOM images. Next, click the "Modules" menu and highlight "Surface Modules". Then select "Model Maker".

The Model Maker module will now appear on the left side of the screen. Under "IO" change the "Models" drop down box to "Create New ModelHierarchy". This will create a new entry called "Models" in this box.

Click "Apply" at the bottom of the module and should now see a 3D rendering of the NRRD label map in the main viewing window.
Visualizing the combined DICOM and NRRD data
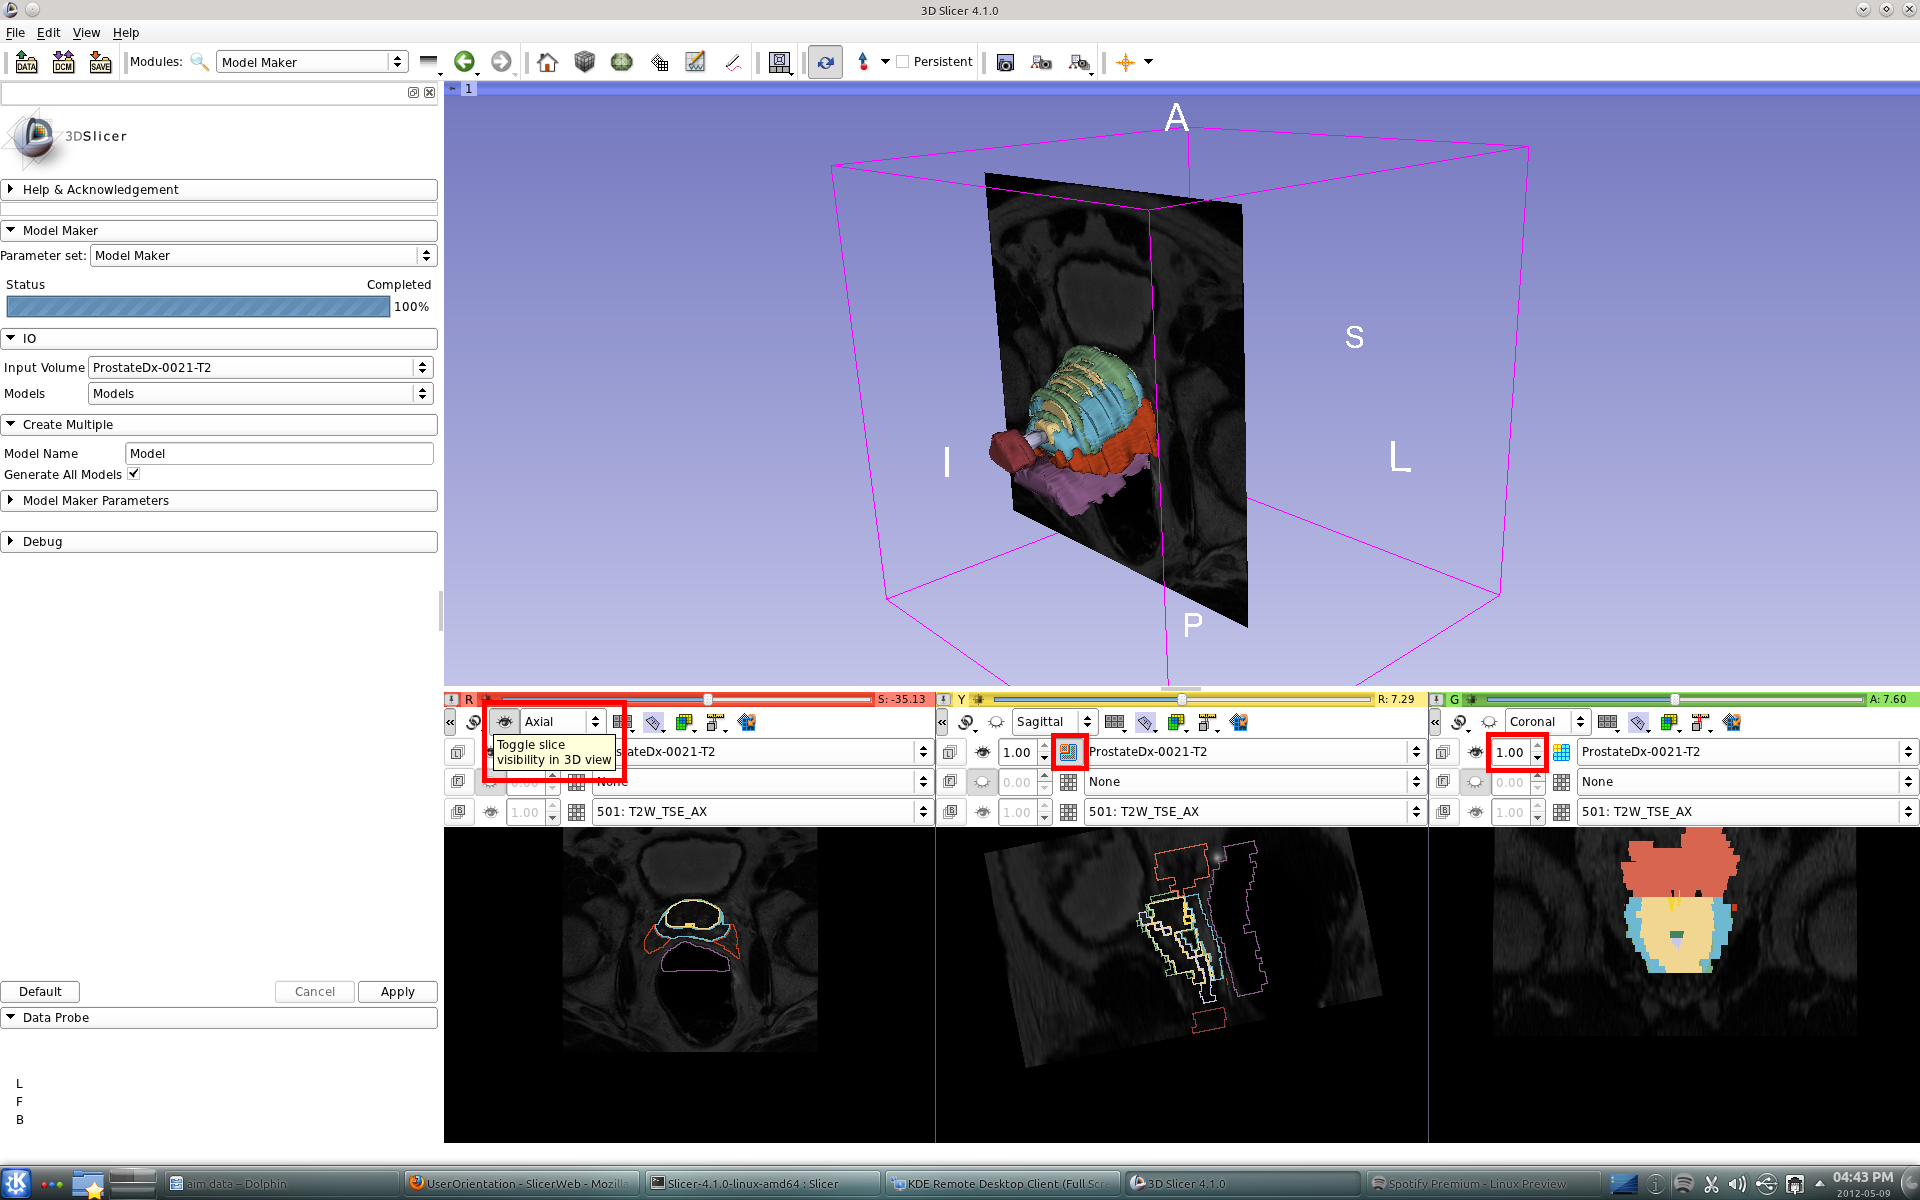
If you prefer you can now tweak some settings to further visualize the data. The following settings are emphasized in the screenshot below.
- You can toggle between showing the label map with regions outlined or filled by clicking the small pushpin on each of the 2D views and selecting or deselecting the button next to the label map name.
- You can modify the transparency of the label map by using the up/down arrows next to the label map name. The starting value is "1.00" which is fully opaque.
- You can also toggle whether the DICOM slices are visible in the 3D view by clicking the visibility button next to the slice orientation.
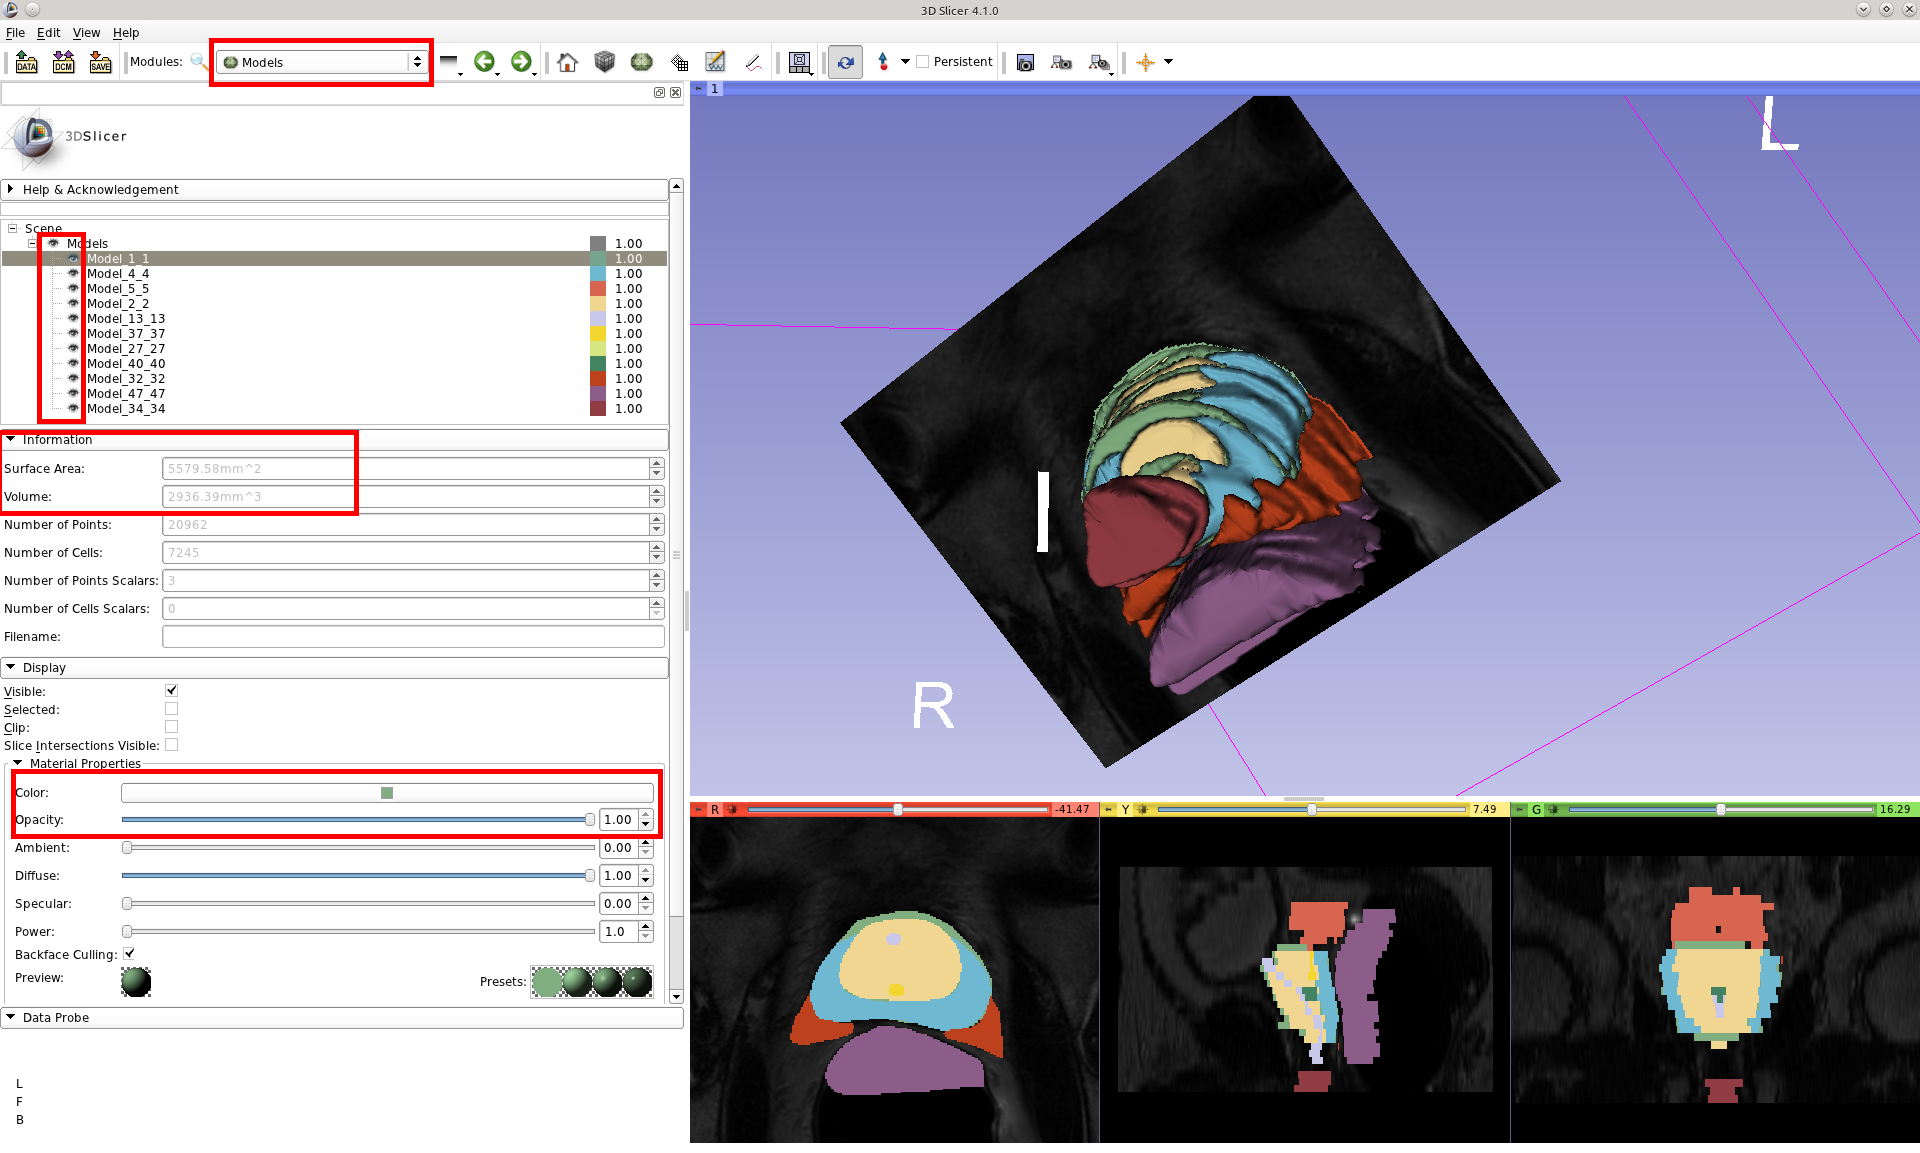
You can also customize the 3D Model view by switching from the Model Maker module to the Models module. Clicking on each of the model components in the list presents options for changing the visibility, colors, opacity, etc. You can also view information about each segmentation component such as surface area and volume.
Note relating to surface area and volume values in the Models module
From Steve Pieper on the Slicer-Devel mailing list:
You can get that in the Information section of the Models module (click on the model you want to measure). Note that this method estimates the volume based on the surface triangles and can fail if there are holes or other topological issues with the model. If you created the models from label maps in slicer, you are better off using the Label Statistics to calculate a volume of a region.
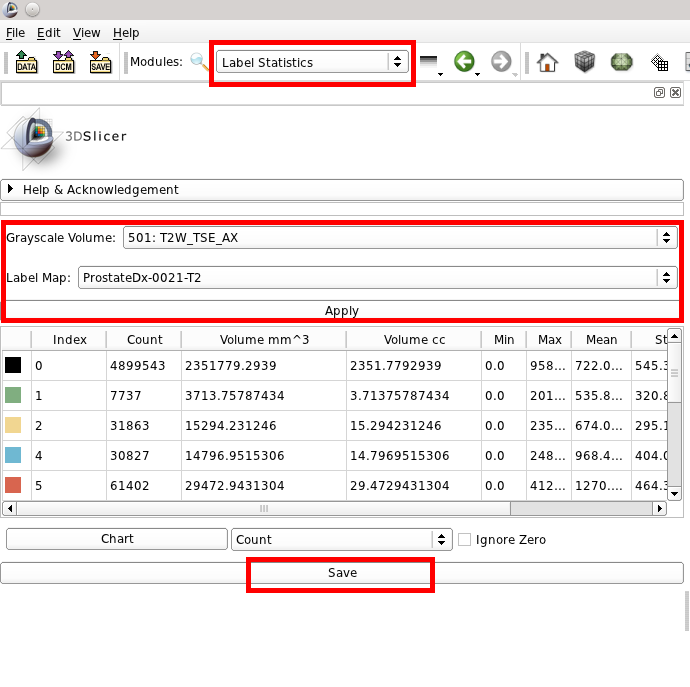
To more accurately calculate volumes and related info use the Label Statistics module, then select your DICOM series for the Grayscale Volume, and the associated label map. Click Apply to calculate the information, and optionally click Save to export this data to a CSV file.