The search results from your query are presented both on the Summary tab in pie charts and on the Search Results tab in a table. Each record in the table corresponds to one subject (patient) and displays the collection(s), study(ies), and image series associated with that subject.
From the Search Results tab, you can view subject details, view all image series associated with the subject, and add image series to your cart for download. You can also view the DICOM header for a selected image series. In the future, you will be able to view the image.
To view subject details
- Search for studies that match criteria that interest you.
The Summary tab refreshes to show your search results in pie chart form. - Click the Search Results tab.
The search results that match your criteria appear sorted by Subject ID.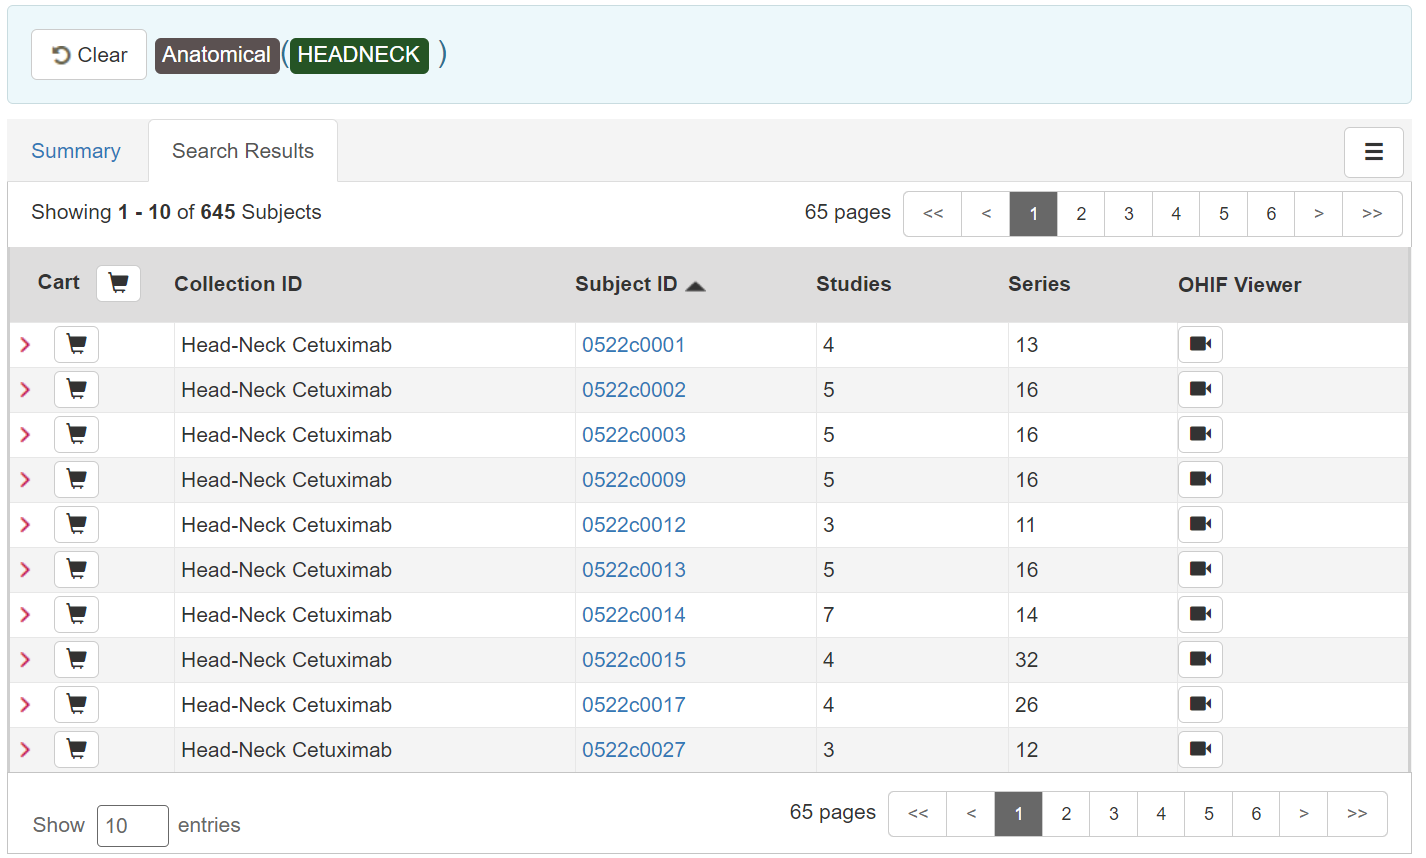
You can now add all studies associated with a subject to your cart at the same time or drill down to an individual study and add it to your cart instead. Click a Subject ID link.
All studies associated with this subject appear. In this example, this subject is only associated with one study, and only one image series is associated with that study.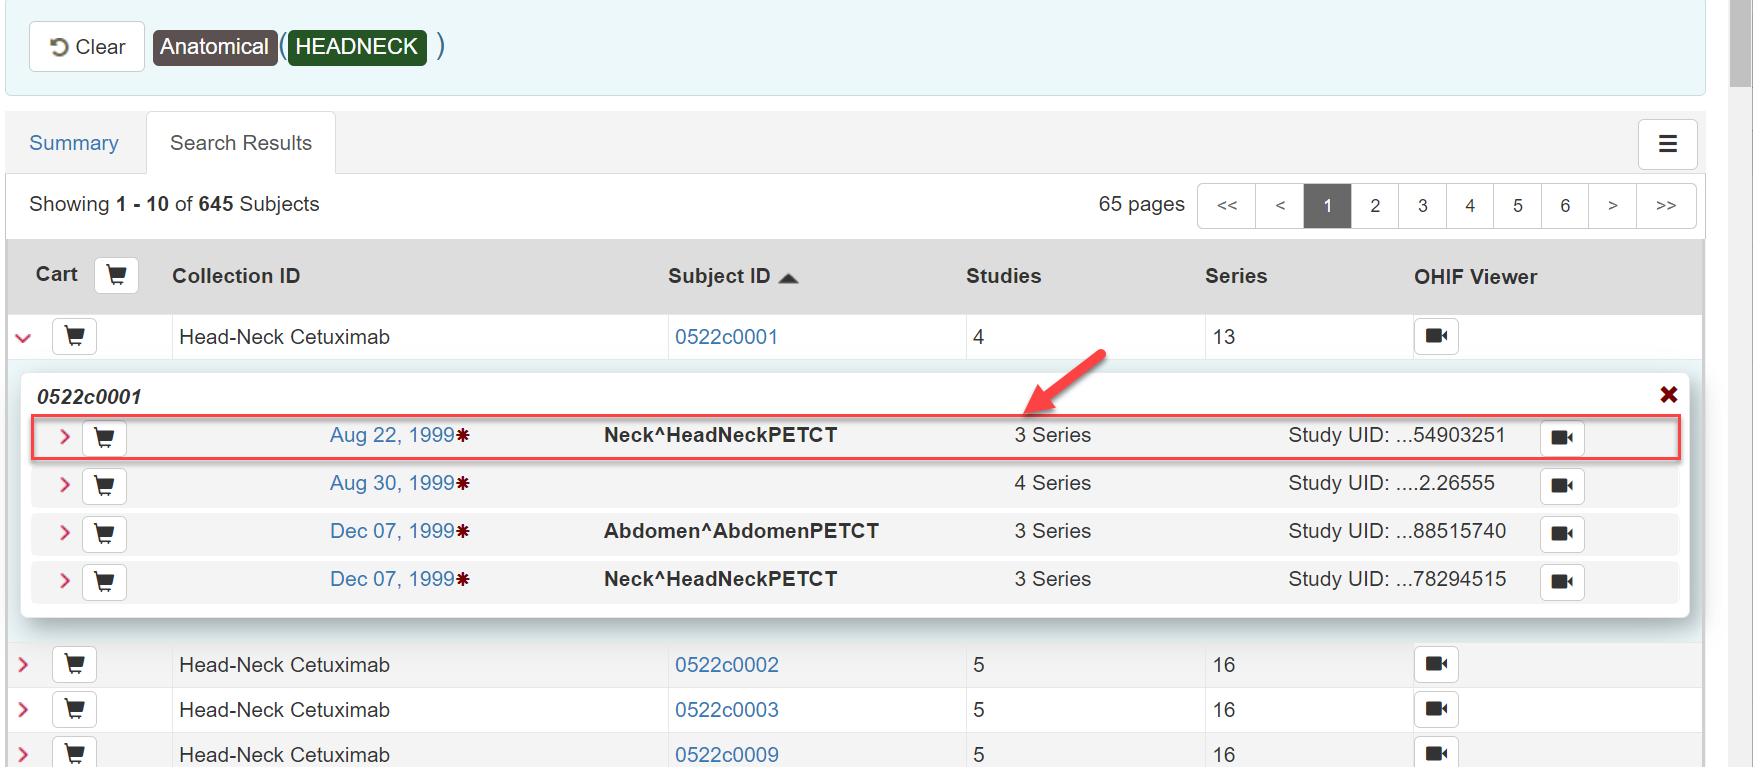
The red asterisk indicates that the date, which is the date that this series was first available at TCIA, has been offset to protect private health information.
- Click the date or the arrow to the left of the study cart icon to view details about the selected study.
All of the image series associated with that study appear.
You can now
- Add an image series to your cart.
- View the series description, modality, manufacturer, number of images, and series ID.
- View thumbnails of the image series.
- View an animation of the image series.
- View DICOM data for this image series.