Summary

The objective of the ACRIN 6684 multi-center clinical trial was to determine the association of baseline FMISO PET uptake (maximal tumor to blood ratio, hypoxic volume) and MRI parameters (Ktrans, CBV) with overall survival, time to disease progression, and 6-month progression free survival in participants with newly diagnosed glioblastoma multiforme (GBM). The trial also collected standard brain cancer data such as Karnofsky performance status, but also pathological biomarkers that included MGMT status, HIF1-alpha, GLUT1, CAIX, CD31, and alpha-SMA expression assays.
There are two sets of volumes of interest (VOI) included with the ACRIN 6684 collection of MRI, PET and low-dose CT patient images. These include delineation of enhancing brain tumor lesions and 18F-FMISO PET hypoxia maps. More information about these masks can be found on the Detailed Description tab below. Additional information about the trial is available in the Study Protocol and Case Report Forms.
ACRIN 6684 Study Protocol
After establishing eligibility and enrollment to the study, baseline imaging of both MR and PET was performed within 2 weeks of starting therapy. FMISO, has been helpful in evaluating tumor oxygenation status, which may affect how well it responds to radiation and chemotherapy. The MRI scans were designed to measure tumor characteristics related to oxygenation status, including changes in blood flow, blood volume, and blood vessel size.
In the original protocol, following baseline imaging was an optional test-retest scan for FMISO PET only. Also included were PET and MRI scans at 3 weeks after the onset of chemo/radiation therapy, and 4 weeks following the end of standard treatment. Of the 50 patients enrolled in the study only one patient had a test-retest FMISO scan, and the requirement of scans mid and post therapy were dropped after the 4th case. The current protocol appears in the figure on the right, and can be found online ( Protocol-ACRIN 6684 Amendment 7, 01.24.12 ). The latest protocol for ACRIN 6684 had PET and MR imaging performed only at baseline, up to 2 weeks prior to standard treatment (chemo + radiation therapy). Mid and post-therapy scans were eliminated from the protocol after Case 4, and only one patient had a retest FMISO scan. Of the 50 enrolled patients, 42 patients had evaluable imaging data for the primary aims of the study (see Gerstner et al. 2016).
Note: The MRI DWI/DTI series acquired through GE or Siemens scanners for 30 patients have been stripped of their b-values and diffusion gradient matrix DICOM header fields making them unable to be processed for ADC map production. The patients scanned with Philips MRI scanners are intact.
Acknowledgements
This shared data set was provided by Elizabeth R. Gerstner, MD, James R. Fink, MD, David A. Mankoff, MD, PhD, and A. Gregory Sorenson, MD, in collaboration with the American College of Radiology Core Lab with recognition to Alexander M. Spence, MD founding Co-PI for ACRIN 6684 who has since passed. Many thanks are due to the ACRIN 6684 trial team, and all the patients participating in the study. This study was supported by the American College of Radiology Imaging network (ACRIN), which received funding from the National Cancer Institute through: R01 CA082500, P30 CA016520, U10 CA180794, U01 CA190254, R50 CA211270 (Muzi); under the American Recovery and Reinvestment ACT of 2009 (ARRA) and UO1 CA079778; and through the NCTN Network Operations Group Awards U10 CA180820.
Please see QIN ECOG-ACRIN Data Sharing page for an overview and list of other ECOG-ACRIN data collections available on TCIA.
Data Access
| Data Type | Download all or Query/Filter | License |
|---|---|---|
| Images (DICOM, 96GB) | (Download requires the NBIA Data Retriever) | |
| Clinical (XLS, zip, 214 KB) |
Click the Versions tab for more info about data releases.
Detailed Description
Collection Statistics | |
|---|---|
Modalities | CT, MR, PET |
Number of Participants | 45 |
Number of Studies | 423 |
Number of Series | 4728 |
Number of Images | 670,828 |
| Image Size (GB) | 96.1 |
Hypoxia masks and MR masks:
There are two sets of volumes of interest (VOI) included with the ACRIN 6684 collection of MRI, PET and low-dose CT patient images. Due to the variation in VOI storage structure between image processing applications, these VOI maps are presented as a single DICOM volume for ease of interpretation. The maps are presented in a binary format where inside the VOI has a value of 1 and outside is zero.
The MRI maps are derived from calibrated MR T1 image series acquired before and after contrast enhancement, through and artificial intelligence machine–learning technique1. The resulting quantitative dT1 maps for the delineation of enhancing brain tumor lesions are generated in the spatial matrix of the MR image series.
The 18F-FMISO PET hypoxia maps were created by initially registering the MR FLAIR image to the 18F-FMISO PET series, and then segmenting the FLAIR hyperintensity to define an outer boundary region for the brain tumor. The FLAIR segmentation was applied to the 18F-FMISO PET series, and the hypoxic volumes were created by a thresholding method that uses the ratio of the tumor activity to the cerebellar cortex activity 2 . The hypoxic volume was determined as the voxels that have a ratio greater than 1.2, indicating significant hypoxia, and are in the spatial matrix of the PET image series.
- Schmainda KM, Prah MA, Zhang Z, Snyder BS, Rand SD, Jensen TR, Barboriak DP, Boxerman JL. Quantitative Delta T1 (dT1) as a Replacement for Adjudicated Central Reader Analysis of Contrast-Enhancing Tumor Burden: A Subanalysis of the American College of Radiology Imaging Network 6677/Radiation Therapy Oncology Group 0625 Multicenter Brain Tumor Trial. AJNR Am J Neuroradiol 40(7):1132-1139. 2019.
- Muzi M, Peterson LM, O'Sullivan JN, Fink JR, Rajendran JG, McLaughlin LJ, Muzi JP, Mankoff DA, Krohn KA. 18F-Fluoromisonidazole Quantification of Hypoxia in Human Cancer Patients Using Image-Derived Blood Surrogate Tissue Reference Regions. J Nucl Med 56(8):1223-1228. 2015.
Limited download option:
As a convenience to users who do not want to download the entire trial dataset, the following links will retrieve only the VOI mask series:
Images (DICOM, 268 MB) Hypoxia masks: Download or Search (Download requires the NBIA Data Retriever)
Images (DICOM, 181 MB) MRI masks: Download or Search (Download requires the NBIA Data Retriever)
Participant Eligibility and Enrollment:
Adult patients newly diagnosed with pathologically confirmedGBM (World Health Organization [WHO] grade IV) that had visible residual disease after surgical resection, and planned for initial treatment with radiation therapy (RT) and temozolomide (TMZ), with or without additional agents, were enrolled. Amount of residual tumor did not impact eligibility and visible residual disease included T2/FLAIR hyperintensity. The study enrolled the first patient in March 2010 and the last in August 2013, with follow up ending 1 year later (July 2014). Final accrual to the study was 50 patients, of which 42 were evaluable for the primary aim analysis as reported by Gerstner et al. 2016.
Date Offsets:
All dates, like the visit date, are protected by presenting just the year; however, dates are also listed as offset days from the base date. The offset dates are used as a means of protecting patient information provided by the local sites in the original data, while allowing users to determine intervals between events. The standard DICOM date tags (i.e. birth dates, imaging study dates, etc.) have been de-identified so that all patients have a baseline study date of January 1, 1960. This falsified date represents the day patients were entered into trial database. The number of days between a subject’s longitudinal imaging studies are accurately preserved. A patient with a study performed on January 4, 1960 means the images were collected 3 days after the base date. For convenience, this calculation has been performed for all scans with the results inserted in DICOM tag (0012,0050) Clinical Trial Time Point ID . This means an imaging study that took place on January 4, 1960 would contain a value of "3" in tag (0012,0050).
ACRIN 6684 MR Imaging
Of the 50 patients enrolled, 42 had evaluable imaging MR studies and 38 patients had evaluable 18F-FMISO PET scans relating to the primary aim. Additionally, 37 patients had evaluable DSC imaging, 31 had evaluable DCE imaging, 39 had evaluable diffusion tensor imaging (DTI) data, 17 had evaluable spectroscopy (MRS) data and 13 patients had BOLD imaging that has never been analyzed. For each MR imaging session, patient scans were completed on 1.5 or 3 T scanners (Philips 3T (12 patients), GE 3T (12 patients), Siemens 3T (2 patients), and Siemens 1.5T (five patients) magnets). The sequence of acquisition for each MR imaging session were as follows:
- Scout
- T1 Pre-contrast Spin Echo
- 3D T2 Rare
- FLAIR
- OPTIONAL: BOLD MRI 2D-EPI during transient inhalation of oxygen, minimum requirement 7 L/min using nasal cannula, 2 saturation levels were collected during this sequence.
- DCE (Dynamic contrast enhanced) 3D-T1 GRE imaging beginning with T1 mapping using 5 flip angles (2,10,15, 20, 30°). 1st injection of Gd.
- DWI/DTI (Diffusion weighted or diffusion tensor imaging) 2D EPI
- DSC (Dynamic susceptibility contrast) 2D EPI imaging following 2nd Gd Injection
- T1 Post-contrast 3D SPGR (MPRAGE)
- T1 Post-contrast Spin Echo
- MRS (magnetic resonance spectroscopy) 3D volumetric
The complete protocol for MR imaging can be found on the ACRIN website (MRI Parameters_062010.pdf).
ACRIN 6684 PET Imaging
Each FMISO PET imaging session consisted of acquiring a low-dose CT transmission scan used for attenuation correction and a PET emission scan at approximately 2 hours after injection of 18FMISO. During the emission scan, blood samples were acquired to determine the maximal tumor-to-blood ratio (TBmax) and the hypoxic volume (HV). Of the 42 patients with FMISO scans, 4 had no blood sampling performed. Patients were scanned using GE Discovery (31 patients), Siemens ECAT (6 patients) or Siemens Biograph (2 patients) PET scanners. Three patients (Cases 2, 3 and 5) were imaged on a Siemens prototype brain MR/PET scanner, that could not be calibrated to known activity units, such as Bq/cc.
Overview of Clinical Data
The basic data flow for legacy ACRIN multi-center clinical trials was that all clinical information provided by the local imaging sites were contained in a series of forms. The form data submitted by local investigators to ACRIN during and after the trial, were manually encoded into the ACRIN CTMS (Clinical Trial Management System), and were cross-checked for accuracy by ECOG-ACRIN personnel. These ACRIN 6684 forms (see the ACRIN 6684 Data Forms page), filled out by the local sites, deliver information on imaging, clinical management of the patient and pathology/outcome variables, like dates of progression and survival, along with other critical information. The image data was initially anonymized while uploading from the local sites through TRIAD software and archived in a DICOM database at ACRIN.
After the trial accrual had ended, the clinical data was sent to the Brown statistical center, that is funded by NCI to provide support for ECOG-ACRIN clinical trials, specifically for analysis of the primary and sometimes secondary aims of the trial. The statisticians at Brown strip all the actual dates, names and other PHI from the CTMS data and create a .csv file for each form that has selected information useful for analysis of the trial data. A Form Description file detailing all the forms used in the study accompanies the .csv data files. Additionally, the accompanying Data Dictionary file lists each element for each form that has been selected for data retention along with a description of each form element.
Extracting clinical (non-imaging) data example:
Beginning with the Form Description.csv file, select the form with the desired information needed, such as form A0.csv the patient Eligibility/Registration form. Next, using the Data Dictionary.csv file, find the form elements listed for A0 (eg., A0exx, where xx is the form element number). The file lists the form number, variable name, its description or label, the type of data, and, when applicable, the option codes and corresponding text values (option code:description pairs like 1=’No’, 2=’Yes’; or 1=’Baseline’, 2=’Post treatment’) for each data element available from the form. In the example in Figure 2, the A0 form element 31d (A0e31d) reports the days between the base date and the day of surgery for the patient. In the corresponding A0.csv file column G lists the days between the base date and surgery for each patient. ACRIN 6684 has about 30 forms and about 2000 form element descriptions listed in the Data Dictionary.
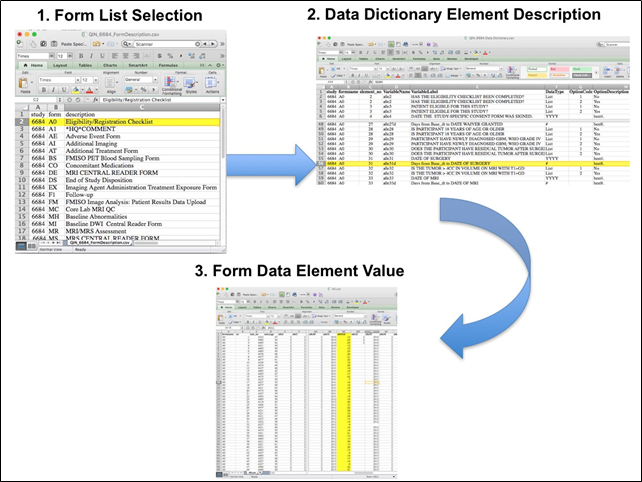
Figure 2: In this example of extracting clinical data, the first step is to 1) find the form from the form list, 2) Find the desired element and description in the Data Dictionary and finally 3) extract the values from the .csv data file.
The procedure above is basically how the statisticians organized the selected data for export, but the structure of the data dictionaries and individual forms are different for each clinical trial.
Citations & Data Usage Policy
Users must abide by the TCIA Data Usage Policy and Restrictions. Attribution should include references to the following citations:
Data Citation
Kinahan, P., Muzi, M., Bialecki, B., & Coombs, L. (2018). Data from ACRIN-FMISO-Brain (Version 2) [Dataset]. The Cancer Imaging Archive. DOI: https://doi.org/10.7937/K9/TCIA.2018.vohlekok
Publication Citation
Gerstner, E. R., Zhang, Z., Fink, J. R., Muzi, M., Hanna, L., Greco, E., Prah, M., Schmainda, K. M., Mintz, A., Kostakoglu, L., Eikman, E. A., Ellingson, B. M., Ratai, E.-M., Sorensen, A. G., Barboriak, D. P., & Mankoff, D. A. (2016). ACRIN 6684: Assessment of Tumor Hypoxia in Newly Diagnosed Glioblastoma Using 18F-FMISO PET and MRI. In Clinical Cancer Research (Vol. 22, Issue 20, pp. 5079–5086). American Association for Cancer Research (AACR). PMC5065740. https://www.ncbi.nlm.nih.gov/pubmed/27185374. DOI: https://doi.org/10.1158/1078-0432.CCR-15-2529
Publication Citation
Ratai, E.-M., Zhang, Z., Fink, J., Muzi, M., Hanna, L., Greco, E., Richards, T., Kim, D., Andronesi, O. C., Mintz, A., Kostakoglu, L., Prah, M., Ellingson, B., Schmainda, K., Sorensen, G., Barboriak, D., Mankoff, D., & Gerstner, E. R. (2018). ACRIN 6684: Multicenter, phase II assessment of tumor hypoxia in newly diagnosed glioblastoma using magnetic resonance spectroscopy. In D. Monleon (Ed.), PLOS ONE (Vol. 13, Issue 6, p. e0198548). Public Library of Science (PLoS). PMC6002091. DOI: https://doi.org/10.1371/journal.pone.0198548
TCIA Citation
Clark, K., Vendt, B., Smith, K., Freymann, J., Kirby, J., Koppel, P., Moore, S., Phillips, S., Maffitt, D., Pringle, M., Tarbox, L., & Prior, F. (2013). The Cancer Imaging Archive (TCIA): Maintaining and Operating a Public Information Repository. In Journal of Digital Imaging (Vol. 26, Issue 6, pp. 1045–1057). Springer Science and Business Media LLC. PMC3824915 DOI: https://doi.org/10.1007/s10278-013-9622-7
Other Publications Using This Data
TCIA maintains a list of publications which leverage our data. If you have a publication you'd like to add please contact TCIA's Helpdesk.
Version 2 (Current): Updated 2019/07/02
| Data Type | Download all or Query/Filter |
|---|---|
| Images (DICOM, 96GB) | (Download requires the NBIA Data Retriever.) |
| Clinical (XLS, zip) | |


Note: The MRI DWI/DTI series acquired through GE or Siemens scanners for 30 patients have been stripped of their b-values and diffusion gradient matrix DICOM header fields making them unable to be processed for ADC map production. The patients scanned with Philips MRI scanners are intact.
Version 1: 2018/02/12
| Data Type | Download all or Query/Filter |
|---|---|
| Images (DICOM, 96GB) | |